
Figures & data
Figure 1. Disruption of clpP decreases the expression of SaeS in S. aureus Newman. (a) The effect of the mutation in ATP-dependent protease genes on the expression of SaeS. Bacteria were grown in TSB and collected at the stationary growth phase (OD600 = 2), then the expression of SaeS was determined by western blot analysis. in this assay, the wild-type (WT), clpP, clpY, clpQ, ftsH mutant strains were used. sae mutant strain was used as a negative control. data were derived from three biological repeats. Sortase (SrtA) was used as a loading control. **, p < 0.01 (versus WT) by unpaired, two-tailed student’s t-test. the quantification of the western blot results is shown on the right. (b) Complementation analysis of the ClpP-mediated regulation of SaeS. Cells were grown as above. SaeS was detected by western blot analysis. the ClpP protein for the complemented strain was determined by His antibody. pCL55, the vector control; pclpP, pCL55 carrying the clpP gene. (c) The effect of the mutation in ClpATPases genes on the expression of SaeS. As with above, SaeS was detected by western blot analysis.The original blots were presented in Supplementary Figure S3, and cropping lines are indicated in red color.
Figure 2. The ClpP-mediated regulation of SaeS affects the production of nuclease. (a) The effect of clpP mutation on the transcription of nuc, the gene encoding nuclease. Cells were grown in TSB until the stationary growth phase (Od600 = 2). The transcript level of nuc was measured by RT-PCR. Data were derived from three biological repeats. sae mutant strain was used as a negative control. ***, p < 0.001 (versus WT) by unpaired, two-tailed Student’s t-test. (b) The effect of clpP mutation on the expression of Nuc protein. Cells were prepared as above. The original figure was presented in Supplementary Figure S4, and cropping lines are indicated in red color. SrtA was used as a loading control. (c) The effect of clpP mutation on the nuclease activity of culture supernatant. Sterile TSB or culture supernatants were incubated at 37°C with salmon sperm DNA. at 30 min, samples were withdrawn and subjected to agarose gel electrophoresis followed by staining with ethidium bromide. WT, wildtype; clpP, clpP mutant; pCL55, a vector control; pclpP, pCL55 containing the clpP gene. sae, sae mutant; TSB, TSB medium.
Figure 3. ClpP can affect the SaeS L18P expression in both an FtsH-dependent and independent manner. The transcription of the ftsH gene (a) and the expression of FtsH (b) were determined in samples prepared from stationary-phase (OD600 = 2) cells grown in TSB. *, p < 0.05 (versus WT) by unpaired, two-tailed Student’s t-test. The quantification of the Western blot results is shown on the right. (c) FtsH is not a substrate of ClpP in vitro. Purified 6-His tag ClpX, ClpP, FtsHc by Ni-NTA agarose were determined by the bicinchoninic acid (BCA) assay and used in the protease degradation assay in vitro. The substrates α-casein and FtsHc were added to the reaction mix independently. Samples were collected at the given point of time, 15 μl samples were taken, and added 2 × SDS loading buffer to stop the reaction. Results were presented by SDS-PAGE with coomassie blue staining. Cells were grown in TSB until the stationary growth phase (Od600 = 2); then, the levels of the SaeS (d) and MbtS (e) protein were measured by Western blot analysis. WT, wild-type; clpP, the clpP mutant; ftsH, the ftsH mutant; clpP/ftsH, the clpP/ftsH double mutant; sae and mbtS mutant strains were used as negative control. SrtA was used as a loading control. Full-length blots are presented in Supplementary Figure S4, and cropping lines are indicated in red color.
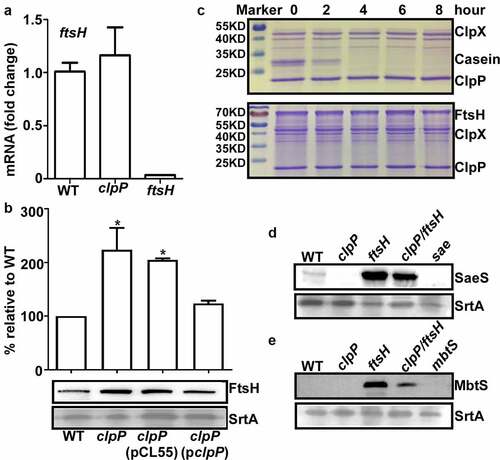
Figure 4. MoeA suppresses the hemolytic activity of S. aureus. (a) The plasmid map for pMA15. (b) The effect of clpP mutation on the expression of alpha-hemolysin. Cells were grown until the stationary growth phase (OD600 = 2). the levels of hla mRNA were measured by quantitative RT-PCR. Full-length blots are presented in Supplementary Figure S4 and cropping lines are indicated in red color. (c) The effect of clpP mutation on the hemolysis activity of culture supernatant. (d) Genes involved in the synthesis and regulation of MoCo in S. aureus.The red arrow is the transposon insertion site. (e) The effect of transposon and deletion mutant on the hemolysis activity of culture supernatant. Cells were grown in TSB until the stationary growth phase (OD600 = 2). the filtrates of the bacterial cultures were used to measure the hemolysis activity against human red blood cells. (f) The effect of clpP/moea double mutant on the expression of saeS. Cells were grown as above. the levels of saeS mRNA were measured by quantitative RT-PCR. WT, wildtype; clpP, clpP mutant; pCL55, a vector control; pclpP, pCL55 containing the clpP gene. sae, sae mutant; clpP/TN-moeA, moeA transposon mutant, and clpP mutant strain; clpP/moeA, moeA and clpP double mutant. the experiment was carried out in triplicates. ***, p < 0.001 (versus WT) by unpaired, two-tailed Student’s t-test.
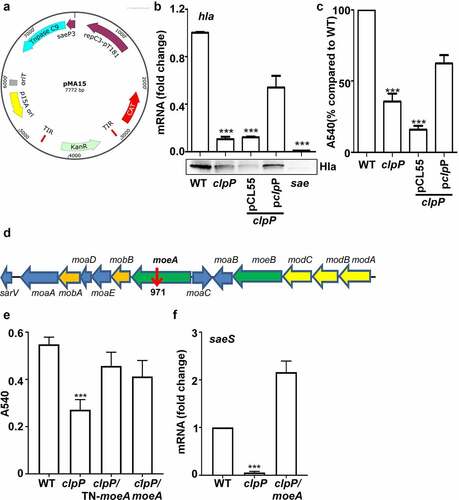
Figure 5. MoeA is a ClpXP substrate and a negative regulator of the SaeRS TCS. (a) Cells were grown in TSB until until the stationary growth phase (OD600 = 2); then, the levels of the MoeA protein were measured byWestern blot analysis. ***, p < 0.001 (versus WT) by unpaired, two-tailed Student’s t-test. (b) ClpP degrades MoeA in vitro. Purified 6-His tag ClpX, ClpP, MoeA by Ni-NTA agarose were determined by the bicinchoninic acid (BCA) assay and used in the protease degradation assay in vitro. The substrates MoeA were added in the reaction mix independently. Samples were collected at the given point of time, 15 μl samples were taken and added 2 × SDS loading buffer to stop the reaction. Results were presented by SDS-PAGE with coomassie blue staining. the quantification of the bands is shown at the bottom. ***, p < 0.001 (versus 0 h) by unpaired, two-tailed Student’s t-test. (c,d) Cells were grown in TSB until until the stationary growth phase (OD600 = 2); then, the levels of the SaeS protein were measured byWestern blot analysis.**, p < 0.01; ***, p < 0.001 (versus WT) by unpaired, two-tailed Student’s t-test. (e) Cells were grown as above; then, the levels of the saeS, hla, and nuc transcripts were measured by RT-PCR. ***, p < 0.001 (versus WT) by unpaired, two-tailed Student’s t-test. WT, wild-type; clpP, the clpP mutant; moeA, the moeA mutant; pOS1, the vector control; pmoeA, pOS1 carrying the moeA gene; clpP/moeA, moeA and clpP double mutant. SrtA was used as a loading control. Full-length blots are presented in Supplementary Figure S5, and cropping lines are indicated in red color.
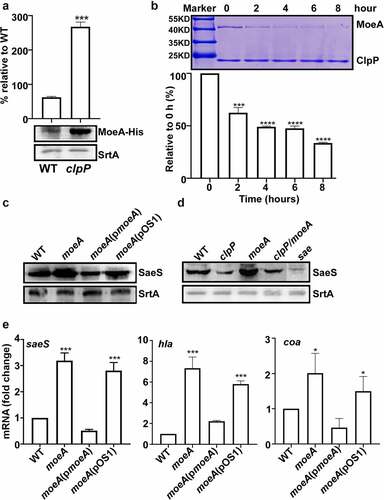
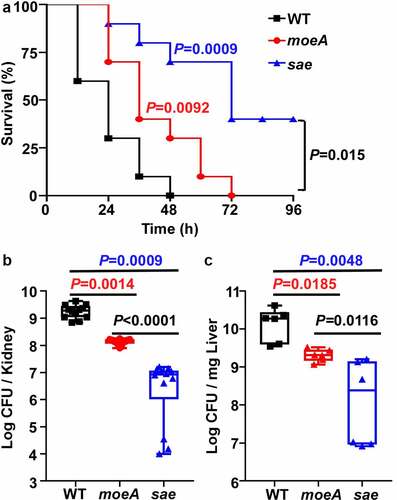
Figure 6. MoeA contributes to S. aureus pathogenesis in Strain Newman. (a) The role of MoeA in staphylococcal virulence during bloodstream infection. the test strains were collected at the exponential growth phase. After washing by PBS twice, the test strains were administered to eight mice via retro-orbital route. the significance of the survival was analyzed by Log-rank (Mantel-Cox) test. (b) The role of MoeA in bacteria growth during bloodstream infection. on day 3 post-infection, the mice were killed, and the kidneys were harvested. the samples were ground and diluted serially. the colony-forming unit (CFU) of S. aureus was measured by plating on tryptic soy agar. the results were representative of the repeated experiment. the statistical analysis was done by unpaired, two-tailed Student’s t-test. WT, wild-type; moeA, moeA mutant; sae, sae mutant.
Supplemental Material
Download MS Word (3.1 MB)Data availability statement
The authors confirm that the data supporting the findings of this study are available within the article and its supplementary materials.