
Figures & data
Table 1. Bacterial strains and plasmids used in this study
Table 2. Primers used in this study
Figure 1. Holo-Transferrin enhances the ability of ExPEC to survive in serum. (a) the transferrin-deficient HIHS, control HIHS, transferrin-deficient HIHS supplemented with holo-transferrin, or apo-transferrin were prepared, then their iron-carrying transferrin signals were detected using ELISA with anti-transferrin antibody. (b) ExPEC strain RS218 was incubated with transferrin-deficient HIHS, control HIHS, transferrin-deficient HIHS supplemented with holo-transferrin or apo-transferrin for 3 h and recovered bacteria were counted. Survival ratios were calculated as the ratio of the number of bacteria recovered from HIHS to the number of original bacteria (1.0 × 10⁷ CFUs). (C) ExPEC strain RS218 was incubated in M9 medium, apo-transferrin supplemented M9 medium, or holo-transferrin supplemented M9 medium for 3 h. Growth abilities were calculated as the ratio of the number of bacteria recovered from medium to the number of original bacteria (1.0 × 10⁷ CFUs). Data are represented mean ± standard error. Statistically differences were determined using unpaired t-test. **P <0.005; ***P <0.001; ns, not significant.
Figure 2. Eftu is located on the surface of ExPEC. (a) Intact ExPEC RS218 bacteria were incubated with a mixture of mouse anti-RS218 antiserum and rabbit anti-EFTu, rabbit anti-OmpA, or rabbit anti-LexA antibody. Permeabilized RS218 cells were incubated with a mixture of mouse anti-RS218 antiserum and rabbit anti-LexA antibody. Cells were then incubated with a mixture of FITC-conjugated anti-mouse IgG and TRITC-conjugated anti-rabbit IgG. to highlight the bacteria, they were stained with DAPI. Fluorescence signals of DAPI, FITC, and TRITC were detected using a fluorescence microscope. Bars, 10 μm. (b) Colonies of ExPEC strain RS218 were covered with NC membrane followed by incubation with antibody against EFTu, OmpA, or LexA. (c) Whole bacterial, surface, and cytoplasmic proteins of ExPEC were subjected to Western blotting and hybridized to antibody against EFTu, OmpA, or LexA. Lane 1, the whole bacterial fractions of RS218 strain; lane 2, the surface proteins; lane 3, the cytoplasmic fractions of RS218.
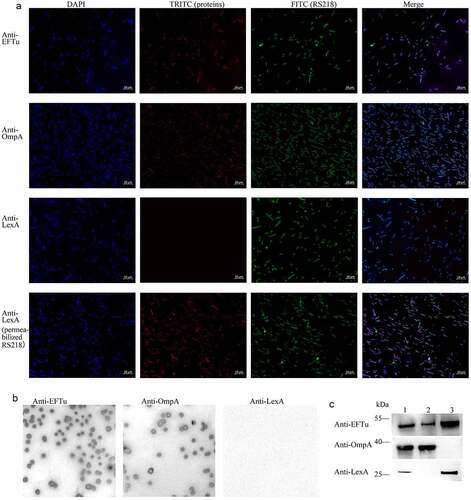
Figure 3. Eftu interacts with holo-transferrin. (a) rEftu was subjected to SDS-PAGE and stained with Coomassie G-250 (lane 1). the rEftu on PVDF membrane was hybridized to anti-EFTu antibody (lane 2). (b) Far-western blotting analysis of holo-transferrin with rEftu. Holo-transferrin (lane 1), rEftu (lane 2), and rHis (negative control, lane 3) were loaded on the PVDF membrane and then incubated with rEftu. the interactions were detected using anti-EFTu antibody. (c) Binding of rEftu and rHis to desthiobiotinylated holo-transferrin or desthiobiotinylated apo-transferrin was detected using ELISA plates coated with different concentrations of recombinant proteins. OD450 values were obtained by incubating with HRP-streptavidin. (d) Different concentrations of rEftu and fluorescein-holo-transferrin were pre-incubated before incubating with ExPEC RS218. Fluorescein-holo-transferrin directly incubated with ExPEC was used as a positive control. the fluorescence intensity of fluorescein-holo-transferrin bound by the bacteria was detected. Relative fluorescence intensity was calculated as the ratio of the treatment group to the positive control. (e) Different concentrations of rEftu incubated with desthiobiotinylated holo-transferrin. Protein mixtures were coated on the ELISA plate. Iron-carrying transferrin and total transferrin signals were detected using anti-transferrin antibody and HRP-streptavidin, respectively. Desthiobiotinylated holo-transferrin that incubated without rEftu served as a control group. the relative value of OD450 was calculated as the ratio of the OD450 value of iron-carrying transferrin signals to that total transferrin signals. Data are represented mean ± standard error. Statistical differences were determined using unpaired t test. ns, not significant; *P <0.05; **P <0.005.
Figure 4. All domains of EFTu contribute to binding holo-transferrin and transferrin-related iron release. (a) δtu1, δtu2, and δtu3 were subjected to SDS-PAGE and stained with Coomassie G-250. (b) Binding of δtu1, δtu2, and δtu3 to desthiobiotinylated holo-transferrin was detected using ELISA plates coated with recombinant proteins. rHis was used as a negative control. OD450 was obtained by incubating with HRP-conjugated streptavidin. (c) δtu1, δtu2, and δtu3 were incubated with desthiobiotinylated holo-transferrin. Protein mixtures were coated on the ELISA plate. Iron-carrying transferrin and total transferrin signals were detected using anti-transferrin antibody and HRP-streptavidin, respectively. the same dosage of desthiobiotinylated holo-transferrin was used as a positive control. the relative value of OD450 was calculated as the ratio of the OD450 value of iron-carrying transferrin signals to that total transferrin signals. Data are expressed as the mean ± standard error. Statistical differences were determined using unpaired t test. ns, not significant, *P <0.05; **P <0.005.
Figure 5. Availability of surface-expressed proteins in BL21 strains carrying a series of pEimc plasmids. (a) Whole bacterial proteins from induced BL21 strains carrying a series of pEimc plasmids were separated by SDS-PAGE and stained with Coomassie G-250. Lane 1, BL21-pEimc; lane 2, BL21-pEimc-EFTu; lane 3, BL21-pEimc-δtu1; lane 4, BL21-pEimc-δtu2; lane 5, BL21-pEimc-δtu3. Arrowheads indicate overexpression of fusion proteins. (b) Induced BL21-pEimc strain observed under a fluorescence microscope. Bars, 10 μm. (c) mCherry fluorescence intensities of the five induced BL21 strains carrying a series of pEimc plasmids were detected at an excitation of 579 nm and an emission of 624 nm. (d) Whole bacteria of the five induced BL21 strains carrying a series of pEimc plasmids were coated onto an ELISA plate. Expression levels of mCherry on the bacterial surface were detected using anti-mCherry antibody. (e) Whole bacteria of induced BL21-pEimc and BL21-pEimc-EFTu strains were coated onto an ELISA plate. the expression level of EFTu on the bacterial surface was detected using anti-EFTu antibody. (f) Surface fractions of induced BL21-pEimc (lane 1) and BL21-pEimc-EFTu (lane 2) strains were detected using Western blotting with anti-EFTu antibody and anti-OmpA antibody. (g) Cytoplasmic fractions of induced BL21-pEimc (lane 1) and BL21-pEimc-EFTu strain (lane 2) were detected using Western blotting with anti-EFTu and anti-LexA antibodies. (h) Gray intensities analysis of protein bands in panel F and G. Data are represented mean ± standard error. Statistical differences in panel C and D were determined using one-way ANOVA, and those in panel E and H were determined using unpaired t-test. ns, not significant; ***P <0.001.
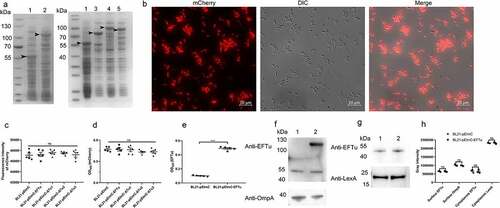
Figure 6. Overexpressed EFTu promotes the binding of holo-transferrin and iron uptake by E. coli. (a) BL21-pEimc, BL21-pEimc-EFTu, BL21-pEimc-δtu1, BL21-pEimc-δtu2, and BL21-pEimc-δtu3 strains were incubated with fluorescein-holo-transferrin, then the fluorescence intensity of fluorescein-holo-transferrin bound to bacteria was detected. (b) Five BL21 strains carrying a series of pEimc plasmids were stained with calcein-AM. Quenching of calcein fluorescence indicating iron uptake was measured in the presence of holo-transferrin at excitation 490 nm and emission 538 nm. (c) Five BL21 strains carrying a series of pEimc plasmids were incubated with desthiobiotinylated holo-transferrin in M9 medium. Protein in supernatants were coated on the ELISA plate. Iron-carrying transferrin and total transferrin signals were detected using anti-transferrin antibody and HRP-streptavidin, respectively. Relative values of OD450 were calculated as the ratio of the iron-carrying transferrin signal to total transferrin signal. Data are expressed as the mean ± standard error. Statistical differences were determined using unpaired t-test. ns, not significant; *P <0.05; **P <0.005; ***P <0.001.
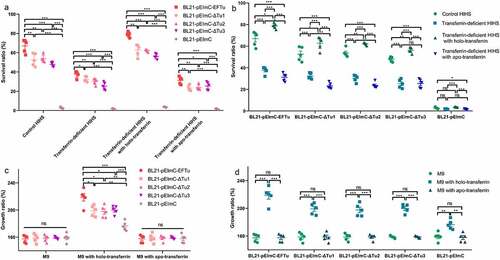
Figure 7. Eftu promotes the viability of E. coli in serum and medium by utilizing holo-transferrin. (a-b) BL21-pEimc, BL21-pEimc-EFTu, BL21-pEimc-δtu1, BL21-pEimc-δtu2, and BL21-pEimc-δtu3 strains were incubated with control HIHS, transferrin-deficient HIHS, transferrin-deficient HIHS supplemented with holo-transferrin or apo-transferrin for 3 h. Bacterial survival ratios were calculated as the ratios of the numbers of bacteria recovered from incubation serums to the numbers of original bacteria. (c-d) BL21-pEimc, BL21-pEimc-EFTu, BL21-pEimc-δtu1, BL21-pEimc-δtu2, and BL21-pEimc-δtu3 strains were incubated with M9 medium, M9 medium supplemented with holo-transferrin, or M9 medium supplemented with apo-transferrin for 3 h. Bacterial growth ratios were calculated as the ratios of the numbers of bacteria recovered from incubation medium to the numbers of original bacteria. Data represent mean ± standard error. Statistical differences were determined using unpaired t test. ns, not significant; *P <0.05; **P <0.005; ***P <0.001.
Supplemental Material
Download PDF (152.7 KB)Data availability statement
The datasets used and/or analyzed during the current study are available from the corresponding author on reasonable request.