
Figures & data
Table 1. Parameters associated with HIV infection during the follow-up
Table 2. Genotypic distribution of INFL4 genotypes in all the cohort, vaccinees and placebo-treated subjects of the Vax004 clinical trial
Figure 1. Kaplan-Meier plot of rate of HIV-1 seroconversion according to IFNL4 genotypes. Survival curves were compared under a dominant model for rs368234815 polymorphism (TT+GT vs. GG) by the log-rank test (P=0.01). G is the functional IFNL4 allele.
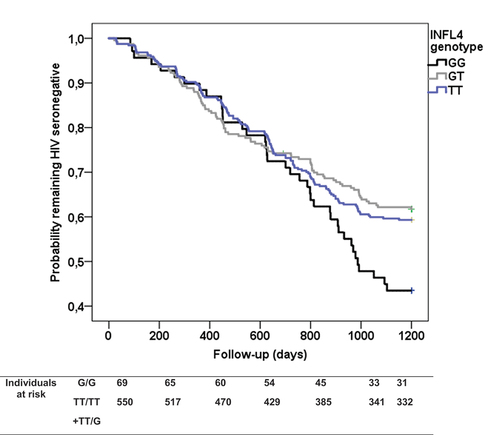
Table 3. Predictors of the HIV-1 seroconversion
Figure 2. Forest plot of meta-analysis of the men who have sex with men (MSM-USA-Vax004 trial), serodiscordant couples (Sex Italy and Spain), and intravenous drug users (IDU) populations from Spain and Estonia (https://metagenyo.genyo.es/) [19]. Odds ratio (OR) and 95% confidence interval (95%-CI) and fixed-effect meta-analysis. P=1.3 x 10⁻⁵ for a dominant model of the protective allele (G/G vs.TT/TT+TT/G).
![Figure 2. Forest plot of meta-analysis of the men who have sex with men (MSM-USA-Vax004 trial), serodiscordant couples (Sex Italy and Spain), and intravenous drug users (IDU) populations from Spain and Estonia (https://metagenyo.genyo.es/) [19]. Odds ratio (OR) and 95% confidence interval (95%-CI) and fixed-effect meta-analysis. P=1.3 x 10⁻⁵ for a dominant model of the protective allele (G/G vs.TT/TT+TT/G).](/cms/asset/4ca065ac-a59a-4c88-a7f2-0ad0126ad7e7/kvir_a_2066612_f0002_b.gif)
Data availability statement
Due to the nature of this research, participants of this study did not agree for their data to be shared publicly, so supporting data is not available. The data generated during the current study are available from the corresponding author on reasonable request.