
Figures & data
Figure 1 Qualitative and quantitative analyses of Mav CFA-specific multifunctional CD4+ T cells in the lung after CFA+GLA-SE or CFA+GLA-SE/CDG immunization. Four weeks after the last immunization, mice were sacrificed, and lung single cells harvested from each group (n = 4) were stimulated by GolgiPlug and GolgiStop with or without 10 µg/ml CFA at 37°C for 9 h. (a) Scheme of the in vivo experiment for immunogenicity and vaccine efficacy analysis. The frequencies of Mav CFA-specific IFN-γ+IL-2+-, IFN-γ+IL-17A+- and IFN-γ+TNF-α+-expressing CD4+CD44+CD62L− T cells were assessed after staining of intracellular cytokines and are presented as (b) pseudocolor dot plots and (c) summary bar graphs. (d) The percentages of total CD4+CD44+CD62L− T cells with differential production of IFN-γ, IL-2, IL-17A and TNF-α in response to CFA stimulation among lung single cells were determined among groups and are presented as bar graphs. (e) The values of the proportions of quadruple- (4+, crimson), triple- (3+, orange), double- (2+, yellow), and single-function (1+, light gray) CD4+CD44+CD62L− T cells expressing IFN-γ, IL-2, IL-17A and TNF-α in each immunized group are illustrated as pie charts. Statistically significant differences among all groups in (c) and (d) were determined by one-way ANOVA with Tukey’s multiple comparison test, and the results are presented as the mean values along with the S.Ds. *p < .05, **p < .01, ***p < .001, ****p < .0001 and n.s.: not significant. The asterisks in (d) represent significant differences between groups: black, control group vs. CFA+GLA-SE/CDG group; red, CFA+GLA-SE group vs. CFA+GLA-SE/CDG group. The representative results are shown from a single in vivo experiment. CFA, culture filtrate antigen; Control, GLA-SE immunization alone; GLA-SE, glucopyranosyl lipid A adjuvant formulated in a stable oil-in-water emulsion; GLA-SE/CDG, GLA-SE plus cyclic-di-GMP.
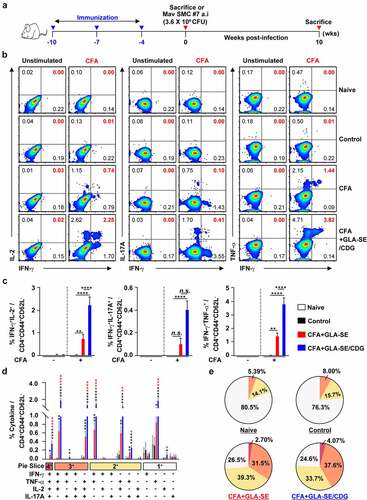
Figure 2 Cytokine profiles of lung and spleen single cells after ex vivo stimulation with CFA. At four weeks after the last immunization, mice were sacrificed, and (a) lung single cells and (b) spleen single cells harvested from each group (n = 4) were stimulated with CFA (0, 2, or 10 µg/ml) at 37°C for 12 h. Secreted cytokines in the collected supernatants were quantified by ELISA, and the data are represented as a scatter plot with bars. Statistically significant differences among all groups in (a) and (b) were determined by one-way ANOVA with Tukey’s multiple comparison test, and the results are presented as the means value along with the S.Ds. *p <.05, **p <.01, ***p <.001, ****p <.0001 and n.s.: not significant. The representative results are shown from a single in vivo experiment. CFA, culture filtrate antigen; Control, GLA-SE immunization alone; GLA-SE, glucopyranosyl lipid a adjuvant formulated in a stable oil-in-water emulsion; GLA-SE/CDG, GLA-SE plus cyclic-di-GMP.
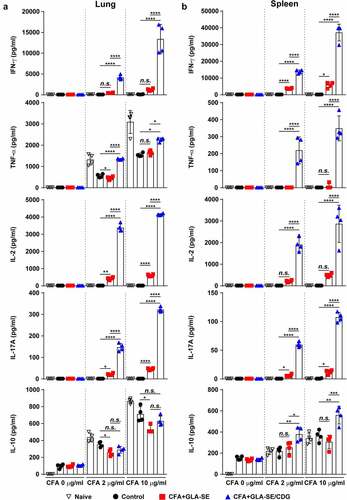
Figure 3 Long-Term prophylactic protective efficacies of CFA+GLA-SE and CFA+GLA-SE/CDG immunization in a murine model of chronic progressive Mav-PI at 10 weeks post-infection. At 10 weeks post-infection, after euthanization of each group of immunized and infected mice (n = 6), (a) gross images and (b) 10× and 200× magnification photomicrographs with H&E staining (scale bars = 3 mm and 200 µm) of the right superior lobe of infected lung tissues were obtained; those of the entire groups are displayed. Each immunized group is indicated on the right side of the images in (a) and (b). (c) Quantitative analysis of the inflamed areas in the H&E-stained lung tissues. the sizes and percentages of the lesions in (b) are presented as a scatter plot with bars. The bacterial burdens (d) in the left lung lobe and half of the spleen in the mice from each group were assessed by counting viable bacterial colonies grown on 7H10-OADC agar plates, and the data are shown as in scatter plot with bars. Statistically significant differences among all groups in (c) and (d) were calculated by the unpaired t test, and the results are represented as the mean values along with the S.Ds. *p <.05, **p <.01 and ****p <.0001. The representative results are shown from a single in vivo experiment. CFA, culture filtrate antigen; Control, GLA-SE immunization alone; GLA-SE, glucopyranosyl lipid a adjuvant formulated in a stable oil-in-water emulsion; GLA-SE/CDG, GLA-SE plus cyclic-di-GMP.
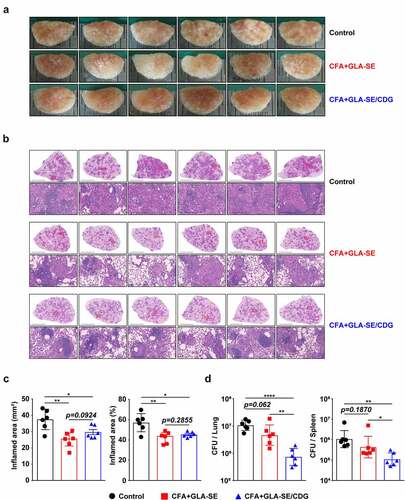
Figure 4 Quantitative and qualitative analyses of the long-lasting induction of Mav CFA-specific multifunctional CD4+ T cells after CFA+GLA-SE or CFA+GLA-SE/CDG immunization in a murine model of chronic progressive Mav-PI at 10 weeks post-infection. At 10 weeks post-infection, the mice were sacrificed, and lung cells harvested from each immunized group (n = 6) and naïve group (n = 4) were stimulated by GolgiPlug and GolgiStop with or without 10 µg/ml CFA at 37°C for 9 h. The frequencies of Mav CFA-specific IFN-γ+IL-2+, IFN-γ+IL-17A+ or IFN-γ+TNF-α+-expressing CD4+CD44+CD62 L− T cells were assessed after staining of intracellular cytokines and are presented as (a) pseudocolor dot plots and (b) summary bar graphs. (c) The percentages of total CD4+CD44+CD62 L− T cells with differential production of IFN-γ, IL-2, IL-17A and TNF-α in response to CFA stimulation among lung single cells were determined among groups and are presented as bar graphs. (d) The values of the proportions of quadruple- (4+, crimson), triple- (3+, orange), double- (2+, yellow), and single-function (1+, light gray) CD4+CD44+CD62 L− T cells expressing IFN-γ, IL-2, IL-17A and TNF-α in each immunized group and naïve group are illustrated as pie charts. Statistically significant differences among all groups in (b) and (c) were determined by one-way ANOVA with Tukey’s multiple comparison test, and the results are presented as the mean values along with the S.Ds. *p <.05, **p <.01, ****p <.0001 and n.s.: not significant. The asterisks in (c) represent significant differences between groups: black, control group vs. CFA+GLA-SE/CDG group; red, CFA+GLA-SE group vs. CFA+GLA-SE/CDG group. The representative results are shown from a single in vivo experiment. CFA, culture filtrate antigen; Control, GLA-SE immunization alone; GLA-SE, glucopyranosyl lipid a adjuvant formulated in a stable oil-in-water emulsion; GLA-SE/CDG, GLA-SE plus cyclic-di-GMP.
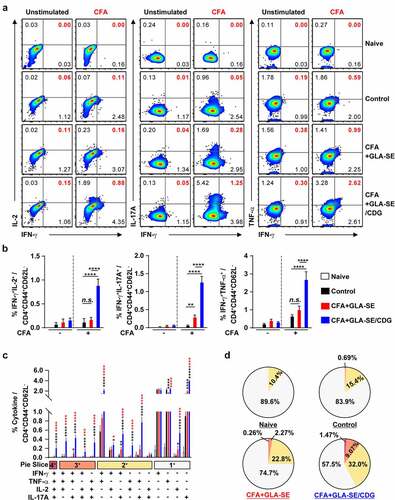
Figure 5 Cytokine profiles of lung and spleen single cells of mice with chronically progressive Mav-PI after ex vivo stimulation with CFA at 10 weeks post-infection. At 10 weeks post-infection, mice were sacrificed, and (a) lung single cells and (b) spleen single cells harvested from each immunized group (n = 6) and naïve group (n = 4) were stimulated with CFA (0, 2, or 10 µg/ml) at 37°C for 12 h. Secreted cytokines in the collected supernatants were quantified by ELISA, and the data are represented as a scatter plot with bars. Statistically significant differences among all groups in (a) and (b) were determined by one-way ANOVA with Tukey’s multiple comparison test, and the results are presented as the mean values along with the S.Ds. *p <.05, **p <.01, ***p <.001, ****p <.0001 and n.s.: not significant. The representative results are shown from a single in vivo experiment. CFA, culture filtrate antigen; control, GLA-SE immunization alone; GLA-SE, glucopyranosyl lipid a adjuvant formulated in a stable oil-in-water emulsion; GLA-SE/CDG, GLA-SE plus cyclic-di-GMP.
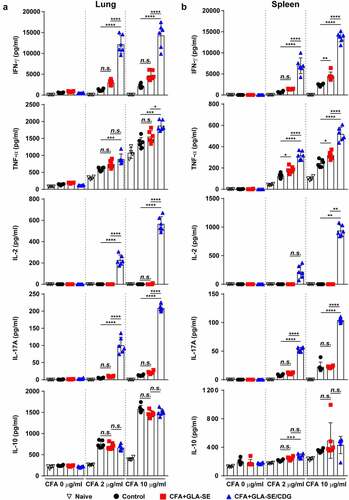
Figure 6 Comparative assessment of the protective efficacies of antibiotic treatment and therapeutic vaccination in a murine model of chronic progressive Mav-PI at 19 weeks post-infection. (a) Scheme of the in vivo experiment. At eight weeks after BALB/c infection with Mav SMC #7, eight weeks of daily therapy was initiated with 100 mg/kg (oral) CLR, along with immunization with CFA+GLA-SE/CDG three times at 3-week intervals. Three weeks after discontinuation of the medication, five mice in each treatment group (n = 5) and four mice in the infection control group were sacrificed, and their lungs were homogenized for bacterial CFU, lung inflammation and immunological assays at 19 weeks post-infection. (b) Gross images and (c) 10× and 200× magnification photomicrographs with H&E staining (scale bar = 3 mm and 200 µm) of the right superior lobe of infected lung tissues of all groups are displayed. Each treatment group is indicated in the upper part of the representative lung pathology image in (b) and (c). (d) Quantitative analysis of the inflamed areas in the H&E-stained lung tissues. The sizes and percentages of the lesions in (c) and the data are presented as scatter plots with bars. The bacterial burdens (e) in the left lung lobe and half of the spleen in each group were assessed by counting viable bacterial colonies grown on 7H10-OADC agar plates, and the data are presented as a scatter plot with bars. Statistically significant differences among all groups in (d) and (e) were calculated by the unpaired t test, and the results are represented as the mean values along with the S.Ds. *p <.05, **p <.01, ***p <.001, and ****p <.0001. The representative results are shown from a single in vivo experiment. CLR, clarithromycin; Control, untreated infection control; CFA, culture filtrate antigen; GLA-SE/CDG, glucopyranosyl lipid a adjuvant formulated in a stable oil-in-water emulsion plus cyclic-di-GMP.
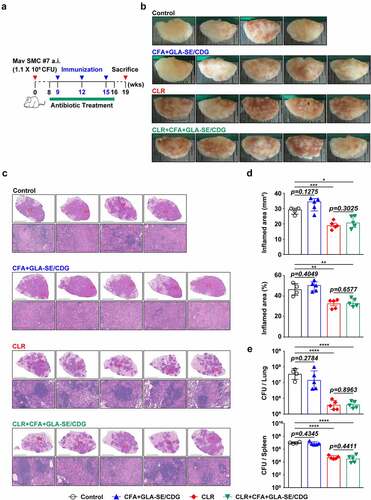
Figure 7 Qualitative and quantitative analyses of Mav CFA-specific multifunctional lung CD4+ T cells after treatment with CLR to boost CFA+GLA-SE/CDG immunization in a murine model of chronic progressive Mav-PI at 19 weeks post-infection. At 19 weeks post-infection, lung cells from sacrificed mice of each treatment group (n = 5) and infection control group (n = 4) were stimulated by GolgiPlug and GolgiStop with or without 10 µg/ml CFA at 37°C for 9 h. The frequencies of Mav CFA-specific IFN-γ+IL-2+-, IFN-γ+IL-17A+- and IFN-γ+TNF-α+-expressing CD4+CD44+CD62 L− T cells were assessed after staining of intracellular cytokines and are presented as (a) pseudocolor dot plots and (b) summary bar graphs. (c) The percentages of total CD4+CD44+CD62 L− T cells with differential expression of IFN-γ, IL-2, IL-17A and TNF-α in response to CFA stimulation among lung single cells were determined among groups and are presented as bar graphs. (d) The values of the proportions of quadruple- (4+, crimson), triple- (3+, orange), double- (2+, yellow), and single-function (1+, light gray) CD4+CD44+CD62 L− T cells expressing IFN-γ, IL-2, IL-17A and TNF-α in each infected, immunized, and treated group are illustrated as pie charts. Statistically significant differences among all groups in (b) and (c) were determined by one-way ANOVA with Tukey’s multiple comparison test, and the results are presented as the mean values along with the S.Ds. *p <.05, **p <.01, ***p <.001, ****p <.0001 and n.s.: not significant. The asterisks in (c) represent significant differences between groups: black, control group vs. CLR group or CLR+CFA+GLA-SE/CDG group; red, CLR group vs. CLR+CFA+GLA-SE/CDG group. The representative results are shown from a single in vivo experiment. CFA, culture filtrate antigen; Control, untreated infection control; GLA-SE/CDG, glucopyranosyl lipid a adjuvant formulated in a stable oil-in-water emulsion plus cyclic-di-GMP; CLR, clarithromycin.
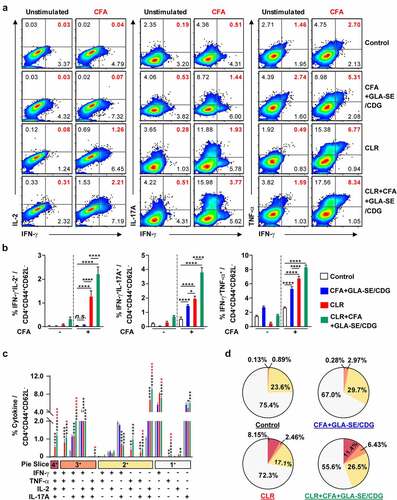
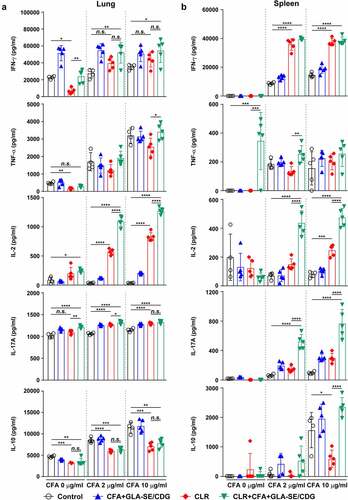
Figure 8 Cytokine profiles of lung and spleen single cells of mice treated with antibiotics and vaccinated with CFA+GLA-SE/CDG in a murine model of chronic progressive Mav-PI, after ex vivo stimulation with CFA at 19 weeks post-infection. At 19 weeks post-infection, mice were sacrificed, and (a) lung single cells and (b) spleen single cells harvested from each treatment group (n = 5) and infection control group (n = 4) were stimulated with CFA (0, 2, or 10 µg/ml) at 37°C for 12 h. Secreted cytokines in the collected supernatants were quantified by ELISA, and the results are presented as a scatter plot with bars. Statistically significant differences among all groups in (a) and (b) were determined by one-way ANOVA with Tukey’s multiple comparison test, and the results are presented as the mean values along with the S.Ds. *p <.05, **p <.01, ***p <.001, ****p <.0001 and n.s.: not significant. The representative results are shown from a single in vivo experiment. CFA, culture filtrate antigen; Control, untreated infection control; GLA-SE/CDG, glucopyranosyl lipid a adjuvant formulated in a stable oil-in-water emulsion plus cyclic-di-GMP; CLR, clarithromycin.
Supplemental Material
Download Zip (28.1 MB)Data availability statement
The raw data that support the findings of this study are available from the corresponding author upon reasonable request.