
Figures & data
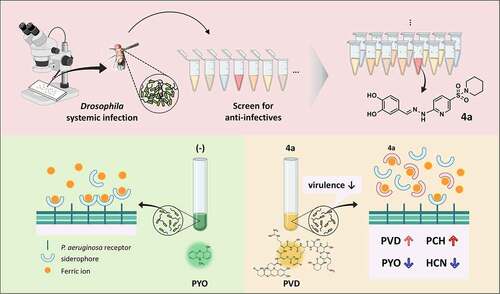
Figure 1. Identification of an antipathogenic hit (4a). (a). Chemical structure of 4a, (E)-4-((2-(5-(piperidin-1-ylsulfonyl)pyridin-2-yl)hydrazono)methyl)benzene-1,2-diol. (b). Antibacterial efficacy of 4a in Drosophila systemic infection model. The flies were systemically infected with P. aeruginosa PA14, V. cholerae N16961, or S. aureus SA3 (MRSA). The infected flies were fed with either nothing (empty) or 500 μM 4a (filled) and their survival rates were determined over time. The dotted lines represent the time required to reach 50% mortality. The statistical significance based on a log-rank test is indicated (***, p < 0.001). (c). Growth of P. aeruginosa PA14 in the presence of 4a. PA14 cells were grown in either LB broth (-) and LB broth containing 500 μM 4a. OD600 values were measured every 20 min for 16 h. The presented values are averages from the three independent experiments with standard deviations. n.s. indicates non-significant based on a p value of over than 0.05 by using Mann–Whitney test. (d). Viability of the 16-h cultures from (c). Ten-fold serial dilutions from the 16-h PA14 cultures in either LB broth (-) or LB broth containing 500 μM 4a were spotted onto an LB agar plate. The numbers indicate the log(cfu) values of the applied bacterial spots, which were calculated from the OD600 values.
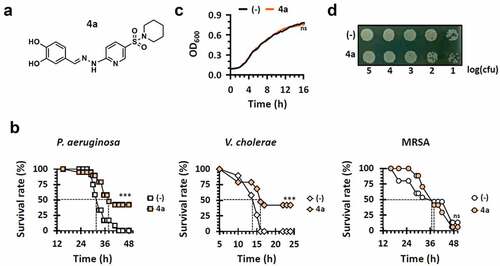
Figure 2. Pigment production by 4a. (a) and (b). Pyoverdine (PVD) and pyocyanin (PYO) production upon 4a treatment in LB broth. PA14 cells were grown in LB broth with either nothing (-) or 500 μM 4a. Pigment production of the 18-h cultures was assessed by visual inspection (a) or by quantification of PVD and PYO (b). The amounts of extracellular PVD (yellow, left y axis) and PYO (green, right y axis) were measured as OD405 and OD520 respectively. (c). PVD and PYO production upon 4a treatment in M9-citrate broth under iron depletion (-) or repletion with either 5 μM FeSO4 (Fe2+) or FeCl3 (Fe3+). The amounts of extracellular PVD (yellow, left y axis) and PYO (green, right y axis) were measured as OD405 and OD520 respectively under 4a treatment at the indicated concentrations. Pigment production of the cultures by visual inspection was shown at the bottom of the graphs.
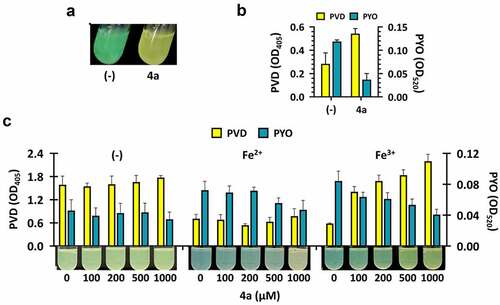
Figure 3. Iron chelation and pigment production by iron chelators. (a). IR spectra of the 4a chelated with irons. The peaks at 592 cm−1 (left) and 591 cm−1 (right) in the spectra could be allocated to the Fe-O bond formation in 7a and 7b, which has been generated as described in SI. (b). Iron chelation activities. Serial 2-fold dilutions of FeSO4 (Fe2+) or FeCl3 (Fe3+) were prepared in TDW (from 0.6 μM to 10 mM) and mixed with 500 μM of the designated compounds at the left: DFP, deferiprone, DFA, deferoxamine, EDTA, and ethylene-diamine-tetraacetic acid, as well as with the 4a derivatives (4b and 6). The minimum concentrations of chelation for the compounds are designated at the right, with the vertical red lines denoting the boundaries between the minimum concentrations of chelation and the maximal concentrations at which no chelation was observed. (c). Growth and pigment production upon the chemical treatment in M9-citrate broth under iron depletion (-) or repletion with either 5 μM FeSO4 (Fe2+) or FeCl3 (Fe3+). The growth and the pigment production of the PA14 cultures under chemical treatments at the increasing concentrations (0, 100, 200, 500, and 1,000 μM) was assessed by visual inspection.
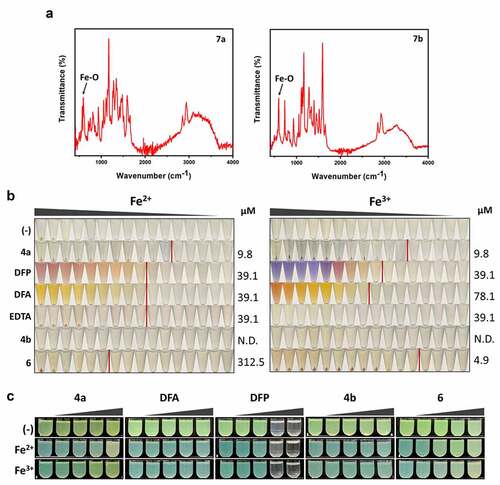
Figure 4. Antibacterial efficacy of other iron chelators. Mortality of infected flies upon administration of iron chelators were measured. The flies were systemically infected with P. aeruginosa PA14 (a and b) and V. cholerae N16961 (c and d). The infected flies were fed with either nothing (empty) or the designated chemicals as in and their survival rates were determined overtime. The dotted lines represent the time required to reach 50% mortality. The statistical significance based on a log-rank test is indicated (***, p < 0.001).
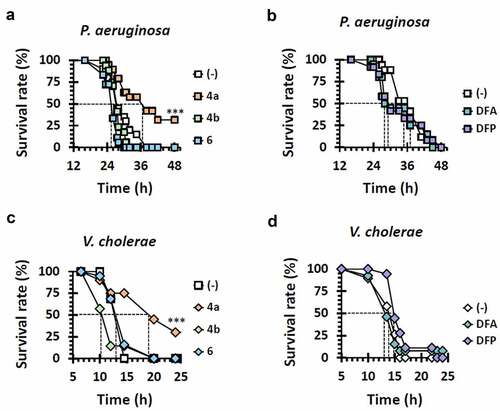
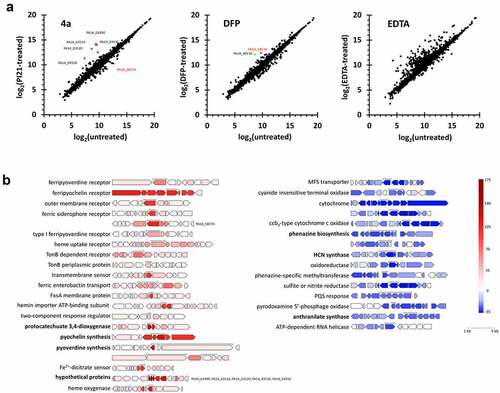
Figure 5. Transcriptome upon 4a. (a). Scatter plots for the transcriptomes of the cells treated with 4a, DFP, or EDTA. The x-axis represents the normalized data (log2) from the un-treated bacteria and the y-axis represents those from the bacteria treated with 4a, DFP or EDTA at 200 µM. (b). Representative 4a-responsive genes and operons in a. Genes with over 2-fold changes in the counted number per gene are marked as red (upregulated) and blue (downregulated) with the intensity scale at the right. The brackets indicate the highest or lowest expressed genes in a gene cluster with description. Each gene cluster is drawn to scale.
Supplemental Material
Download Zip (3.8 MB)Data availability statement
The data that support the findings of this study are available from the corresponding author upon reasonable request.