
Figures & data
Table 1. Primers for qRT-PCR in this study
Table 2. The specific siRNA sequence in this study
Figure 1. Differential expression of mRnas in BMDM cells infected with M. bovis.
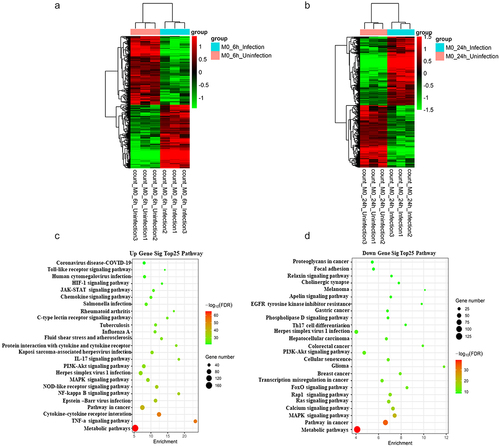
Figure 2. GBP2b was identified for further study.
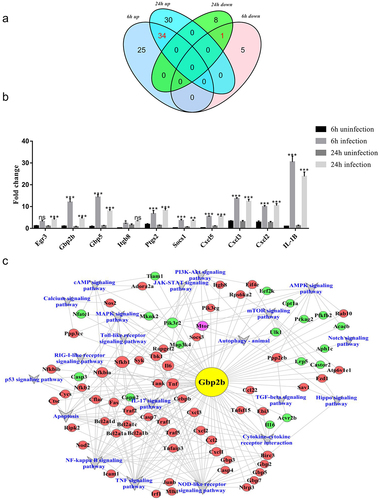
Figure 3. M. bovis induced upregulation of GBP2b in vitro and in vivo. (a and b) Detection of GBP2b protein and mRNA levels by Western blot and qRT-PCR in BMDM cells infected with the indicated MOI (0, 2, 10, and 50) M. bovis for 24 h (a) or infected with M. bovis for MOI 10 at different time points (0, 6, 12 and 24 h) (b). (c) After 4 weeks, the spleen and lung tissues of mice nasally inoculated with PBS or M. bovis were collected for qRT-PCR. (d) Immunohistochemistry analysis for GBP2b in spleen tissue from a mouse inoculated with PBS or M. bovis. Scale bar = 100 µm. GAPDH acts as load control. MOI represents multiplicity of infection; Hour PI represents hours post-infection; n = 3; * represents P < 0.05 and *** represents P < 0.001.
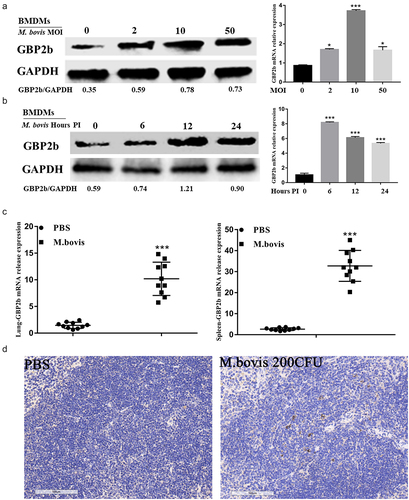
Figure 4. Autophagy is induced in M. bovis-infected BMDM cells. (a and b) Detection of protein level of LC3I/LC3II and Beclin-1 in BMDM cells infected with the indicated MOI (0, 2, 10, and 50) M. bovis for 24 h (a) or infected with M. bovis for MOI 10 at different time points (0, 6, 12 and 24 h) by Western blot (b). (c and d) BMDM cells infected with the indicated MOI (0, 2, 10, and 50) M. bovis for 24 h (c) or infected with M. bovis for MOI 10 at different time points (0, 6, 12, and 24 h) (d) were immune-stained by anti-LC3II antibody (red). DAPI (blue) for staining cell nuclei. Scale bar = 10 µm. (e and f) Detection of protein level of LC3I/LC3II in the nucleus and cytoplasm of BMDM cells infected with the indicated MOI (0, 2, 10, and 50) M. bovis for 24 h (e) or infected with M. bovis for MOI 10 at different time points (0, 6, 12 and 24 h) by Western blot (f). GAPDH acts as load control. MOI represents a multiplicity of infection; Hour PI represents hours post-infection; n = 3; ** represents P <0.01 and *** represents P <0.001; ns represents no significance.
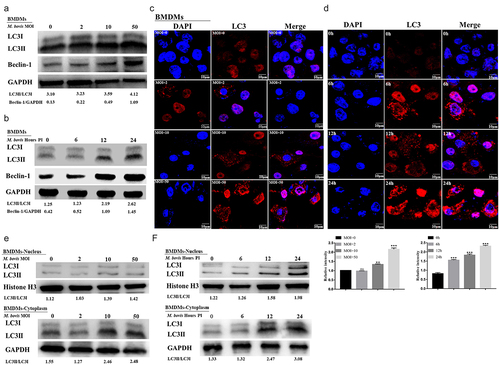
Figure 5. Downregulation of GBP2b reduces the induction of autophagy in mouse macrophages with M. bovis infection. Note: Both BMDM cells and RAW264.7 cells were transfected with GBP2b-specific siRNA (siGBP2b) and control siRNA (siCon), respectively, and then infected 6 and 24 h with M. bovis (MOI 10). (a and b) the protein and mRNA levels of GBP2b was determined in BMDM cells (a) or RAW26.7 cells (b) infected 24 h with M. bovis by Western blot and qRT-PCR. (c and d) the LC3I/LC3II and Beclin-1 protein levels were determined in BMDM cells (c) or RAW264.7 cells (d) by Western blot after 6 and 24 h infected with M. bovis, respectively. (e and f) BMDM cells (e) and RAW264.7 cells (f) infected 24 h with M. bovis were immune-stained by anti-LC3II antibody (red). DAPI (blue) for staining cell nuclei. Scale bar = 10 µm. (g and h) the LC3I/LC3II and Beclin-1 protein levels in BMDM cells were detected by Western blot after being exposed to 1.5 nM rapamycin (g) or 100 nM bafilomycin A1 (h) for 12 h and then infected with M. bovis for 24 h. GAPDH acts as load control. n = 3; * represents P < 0.05 and ** represents P < 0.01 and *** represents P < 0.001; ns represents no significance.
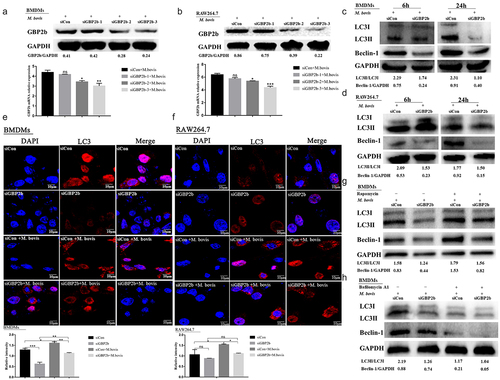
Figure 6. Downregulation of GBP2b expression reduces autophagy by downregulating AMPK/mTOR/ULK1 signaling during M. bovis infection. (a and b) the protein levels of p-AMPK, AMPK, p-mTOR, mTOR, p-ULK1, and ULK1 were determined by Western blot in BMDM cells (a) and RAW264.7 cells (b) transfected with siGBP2b and siCon and then infected 0, 6, and 24 h with M. bovis (MOI 10). (c and d) the mRNA levels of AMPK, mTOR, and ULK1 were determined by qRT-PCR in BMDM cells (c) and RAW264.7 cells (d) transfected with siGBP2b and siCon and then infected 0, 6, and 24 h with M. bovis (MOI 10). GAPDH acts as load control. n = 3; * represents P < 0.05 and ** represents P < 0.01 and *** represents P < 0.001; ns represents no significance.
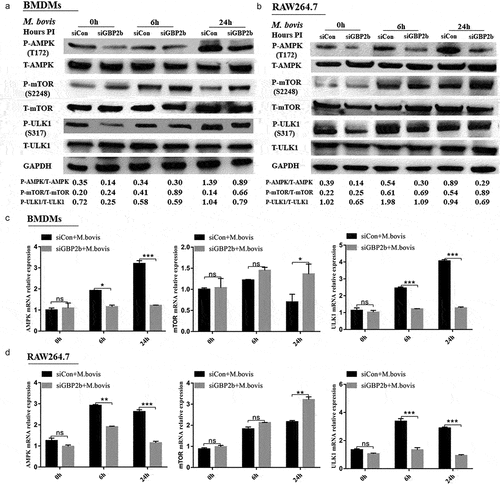
Figure 7. Autophagy is mediated by the AMPK signal during M. bovis infection. Note: BMDM cells transfected with siCon or AMPK-specific siRNA (siAMPK-1, siAMPK-2, siAMPK-3) and then were infected with M. bovis (MOI 10) for 24 h. (a) The protein and mRNA levels of AMPK in BMDM cells were determined by Western blot and qRT-PCR, respectively. (b) The p-ULK1, ULK1, p-mTOR, and mTOR protein levels in BMDM cells were determined by Western blot after being infected with M. bovis for 24 h. GAPDH acts as load control. n=3; *** represents P < 0.001; ns represents no significance.
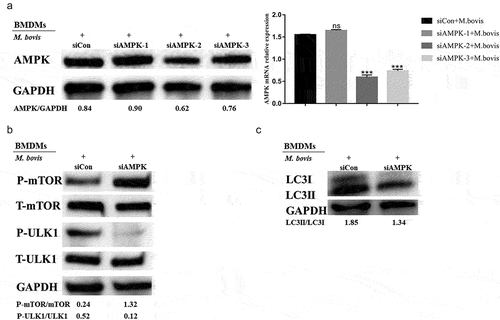
Figure 8. Downregulation of GBP2b and AMPK promotes M. bovis replication in macrophages. (a and b) Calculation of bacterial CFUs in BMDM cells (a) and RAW264.7 cells (b) transfected with siCon and siGBP2b after infected with M. bovis (MOI = 10) at different time points (0, 6, 12, 24, 48 and 72 h). (c and d) Calculation of bacterial CFUs in BMDM cells (c) and RAW264.7 cells (d) transfected with siCon and siAMPK after being infected with M. bovis (MOI = 10) at different time points (0, 6, 12, 24, 48 and 72 h). n = 3; * represents P < 0.05 and ** represents P < 0.01 and *** represents P < 0.001; ns represents no significance.
Supplemental Material
Download Zip (28 MB)Data availability statement
The supplement tablets can be found at the following link: https://doi.org/10.6084/m9.figshare. 16696033v3 The original dataset is available in a publicly accessible repository. The original contributions presented in the study are publicly available. These data can be found in the following link: https://dataview.ncbi.nlm.nih. gov/object/PRJNA766808?reviewer = 1773orf0n9v4duecrgrtdrfta5; The BioProject ID is PRJNA766 808.