
Figures & data
Table 1. Criteria used to determine group allocations
Table 2. Antigens included in 384-well ELISA. Each well contained a single antigen with duplicate wells per antigen. Except where noted, recombinant proteins were expressed in HEK293 cells
Table 3. Demographic characteristics of study participants
Figure 1. Prevalence of IgG specific for betacoronavirus RBDs in study cohort. Plasma was assayed by ELISA using recombinant, multimeric RBD as antigen. (a) SARS-COV-2 spike 319-591 with p values from ANOVA with Tukey HSD for all pairwise comparisons shown beneath. (b) SARS-CoV spike 384-655 with p values shown as above, (c) MERS spike 306-577. Each point indicates an individual participant. Blue bars show median values. N = 7–30. (d) Comparison of absorbance values for MERS and SARS-CoV RBD binding IgG for all participants. Each point indicates an individual participant, n = 124. The orange circle indicates participants with detectable amounts of MERS RBD-binding IgG, showing correlation with SARS-CoV-binding IgG in this subset. IgG specific to recombinant, multimeric RBD from seasonal betacoronaviruses, (e) OC43 spike 315-675, (f) HKU1 spike 307-675 assayed by ELISA as above.
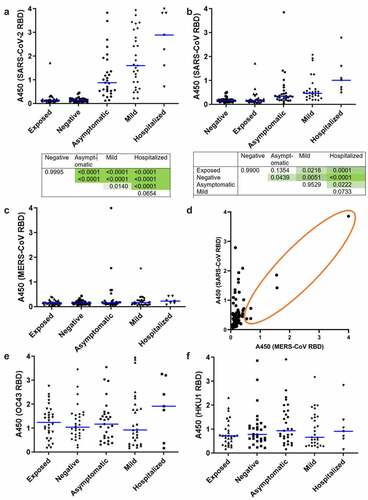
Figure 2. Prevalence of IgG specific for recombinant betacoronavirus proteins and domains. (a) Plasma was assayed by ELISA against the indicated recombinant protein antigens. The mean optical density seen for each group is shown as a heatmap, where darker color indicates greater average abundance of antibodies against the indicated antigen. (b) Abundance of antibodies to SARS-CoV nucleocapsid protein in individual donors. Each point indicates an individual donor. Blue lines indicate median values. Significant p values between the three infected groups are indicated (ANOVA with Tukey HSD, p < 0.05, n = 7–30). Pairwise differences are also significant between each of the three infected groups and each of two uninfected groups but are omitted for clarity.
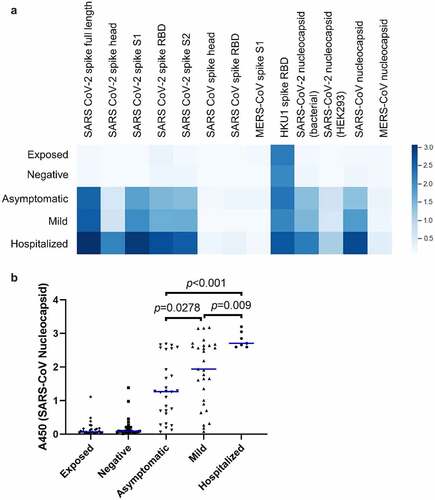
Figure 3. Prevalence of IgGs specific for SARS-CoV-2 peptides. (b) Individual peptides with significant variation between groups (p < 0.05, ANOVA, n = 7–30). Bars denote groups with significant differences by pairwise comparison (Tukey HSD, p < 0.05).
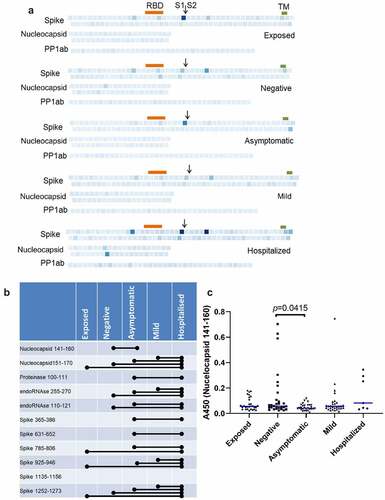
Figure 4. Peptides that differentiate between groups in logistic regression analysis. Peptides that distinguish between groups with more than 30% predicative effect above random are shown. (a) Hospitalized vs. asymptomatic; (b) Hospitalized vs. mild; (c) Mild vs. negative.
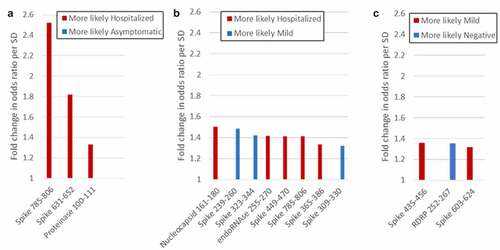
Figure 5. Frequency of seropositivity for IgGs specific to individual peptides in the different groups. (a) Frequency of seropositivity for each peptide. Each square indicates an individual peptide with color intensity proportionate to the frequency with which individuals in each group show antibody binding above background. Arrangement of squares indicates the approximate relative locations of the overlapping peptides in spike, nucleocapsid, and polyprotein 1ab proteins. Approximate locations of the RBD (319-541, orange), S1/S2 furin cleavage site (685, arrow), and transmembrane domain (1213-1237, TM, green) are shown for spike. (b) Distribution of peptides according to frequencies of seropositivity within each group. (c) Frequency of seropositivity for IgG specific to spike 506-525 in each group
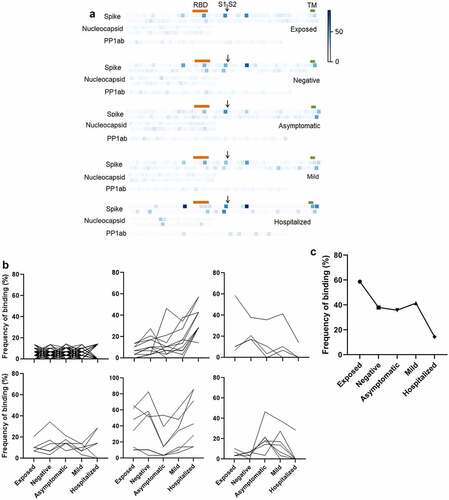
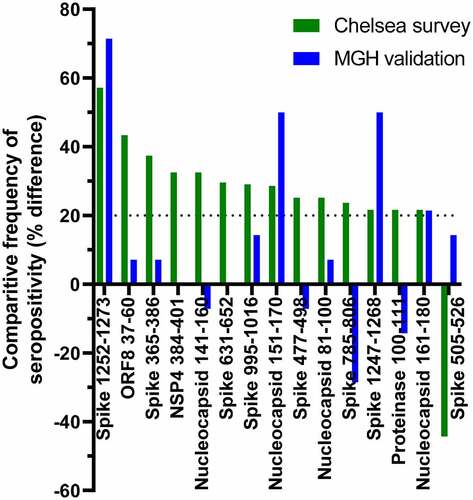
Figure 6. Comparison between peptide seropositivity frequencies in the primary dataset with an independent cohort. Peptides that showed >20 percentage point difference in frequency of seropositivity between participants in the Chelsea survey who had been hospitalized and those who reported exposure to SARS-CoV-2 are shown in green. The differences in frequency of seropositivity for IgG specific to those peptides between acutely hospitalized patients and people with no history of infection are shown in blue.
Supplemental Material
Download MS Excel (17.6 KB)Data availability statement
The authors confirm that the data supporting the findings of this study are available within the article and its supplementary materials.