
Figures & data
Figure 1. T.marneffei infection resulted in liver injury in C57BL/6J mice. (a) Whole blood and liver tissue homogenates were incubated at 28℃ for 3d on PDA plates. Large numbers of hyphae and conidia were found on the surface of the medium in the T.marneffei infection group. (b) H&E staining, PAS staining and GMS staining, 200 × . The infection group exhibited obvious inflammatory lesions, inflammatory cell infiltration, disordered arrangement of cell cords, unclear structure and hepatocyte necrosis. In GMS staining, the red arrows point to T.marneffei. (c) TEM, the red arrows pointed to T.marneffei. (d) Liver index (liver weight/body weight) between control group and infection group at 3, 7 and 14 dpi, respectively. (E and F) AST and ALT were determined to estimate hepatic damage. (*P<0.05, **P<0.01, ***P<0.001).
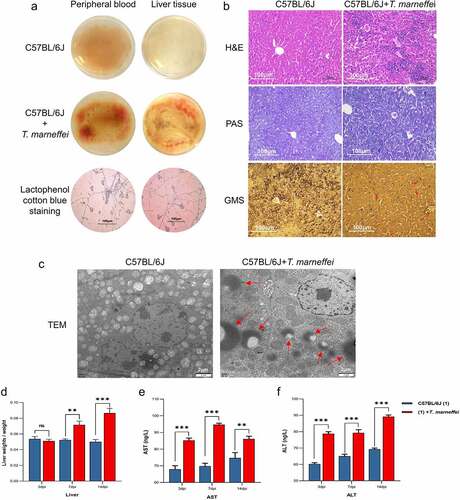
Figure 2. RNA-Seq analysis of C57BL/6J mice liver tissues at 3, 7 and 14 days post T.marneffei infection. (a) Principal component analysis on RNA-seq data. The data showed clear grouping of replicate samples for same developmental stage and infection groups. PC1 on the X-axis captures the greatest variation and accounts for 77% of the total variance around the PCs, while PC2 on the Y-axis captures thesecond greatest variation and accounts for 15% of the total variance around the PCs. (b) Volcano plots of DEGs at 3, 7 and 14 dpi. The mean expression level for control group vs. infection group was assessed for fold-change (X-axis) vs P-value (Y-axis) by Wald test based on DEseq2 package. Each gene is represented by afilled circle. Red indicates ahigher expression level in infected group compared with control group, while green means the opposite. The genes marked in the figures are: Nlrp1a, Nlrp1b, Nlrp3, Nlrc4, caspase-1, caspase-4, Aim2, Il-1β, Il-18, Tnf-α, Gsdmd. (c) the chord diagram. The abundance of top 10 KEGG pathways according to adjusted P-value in the different time points was exhibited.
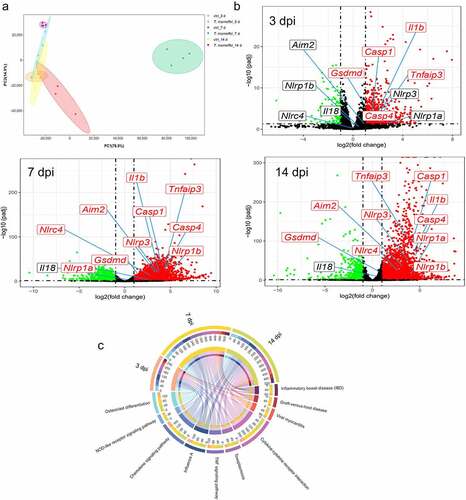
Figure 3. The expression levels of pyroptosis associated factors. (a) Heatmap of genes involved in different types of cell death. Red represents high expression, and blue represents low expression. (b) the mRNA expression level of different pyroptosis related genes. All of these genes are involved in the NOD-like receptor signaling pathway. (c) Results of GSEA analysis. Pyroptosis related genes were all enriched in the NOD-like receptor signaling pathway in different time points when C57BL/6J mice infected with T.marneffei. Enrichment score (ES) and FDR were shown. Red curve indicates enrichment score (ES), the gray shadow at the bottom represents the Log2 fold of change value of each gene. (*P< 0.05, **P< 0.01, ***P< 0.001).
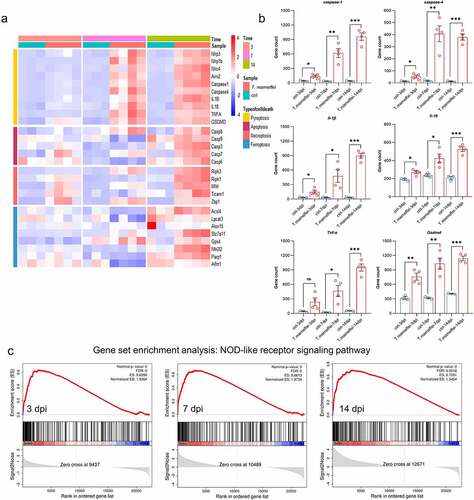
Figure 4. The expression level of pyroptosis associated factors in liver tissue of T.marneffei-infected C57BL/6J mice. (a) Immunofluorescence result of the infected group vs. control group in different time points. (b) Representative immunohistochemistry images showing increased staining of caspase-1 protein expression at 14 din samples from T.marneffei-infected mice. The red arrows point to increased caspase-1 protein. (c) the transcriptional level of different pyroptosis related genes. caspase-1/-4, Il-18 and Tnf-α were up-regulated at 3 dpi, and continued to rise with ongoing infection, while Gsdmd exhibited higher level at 3 dpi, and the expression significantly decreased at 14 dpi. (d) the protein expression level of pyroptosis critical proteins by western blot. (*P< 0.05, **P< 0.01, ***P< 0.001).
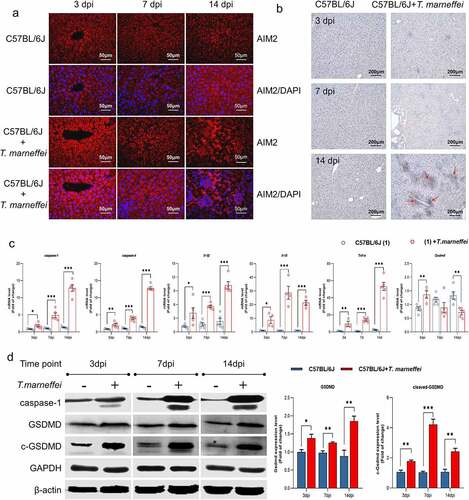
Figure 5. The expression levels of pyroptosis associated factors in AML-12 cells. (a) Light and transmission electron micrographs of AML-12 cells infected by T.marneffei. There was asignificant increase in cell death after 48 hof T.marneffei infection, and T.marneffei conidia were found inside the AML-12 cells. The red arrows pointed to T.marneffei. (b) the cell supernatant was collected to detect the LDH expression after 48 hof infection. The level of cell damage was decreased when treated with VX765 (the inhibitor of caspase-1/-4) and NSA (the inhibitor of GSDMD and MLKL) (c) the mRNA expression level of different pyroptosis related genes. (d) the protein expression level of pyroptosis critical proteins by western blot. (*P< 0.05, **P< 0.01, ***P< 0.001).
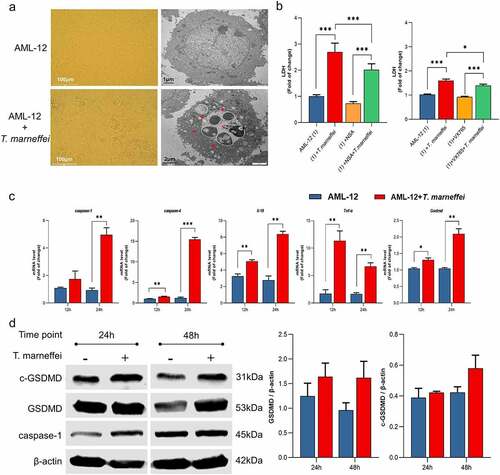
Figure 6. The expression level of pyroptosis associated factors after inhibiting caspase-1 in AML-12 cells. (a) After lentiviral transfection, the expression of pyroptosis related factors in T.marneffei-infected cells was detected at 48 hpost infection. Compared with the cells transfected with NC group, the expression level of caspase-1 was decreased in RNAi-caspase-1 group, but the mRNA level of downstream inflammatory factors was not suppressed, and caspase-4 reflected ahigher expression level. (b) the expression levels of pyroptosis related proteins in caspase-/- AML-12 cells at 48 hpost infection. Although the expression of caspase-1 protein was significantly decreased after siRNA transfection, the expression of downstream GSDMD and cleaved-GSDMD proteins were still increased. (*P< 0.05, **P< 0.01, ***P< 0.001).
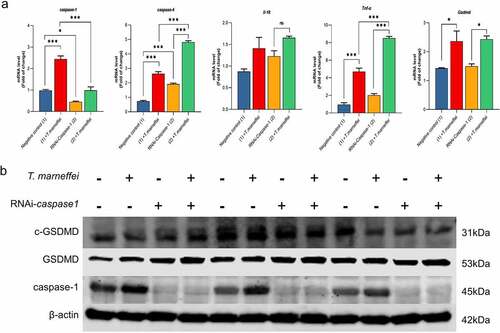
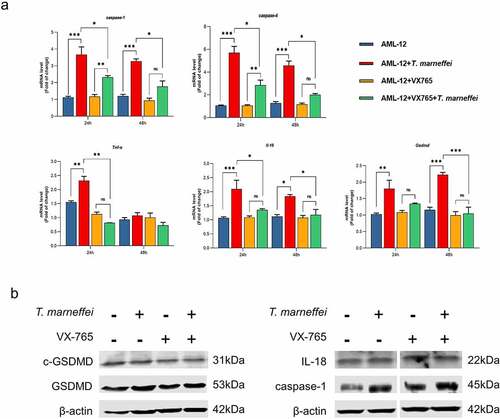
Figure 7. The expression level of pyroptosis associated factors after VX765 pretreatment in AML-12 cells. (a) After VX765 pretreatment, the expression of pyroptosis related factors in T.marneffei-infected cells was detected after 48 hof infection. Caspase-1 and -4 were all suppressed, and downstream inflammatory factors were also decreased. (b) the expression levels of pyroptosis related proteins in VX765-pretreated AML-12 cells at 48 hpost infection. Compared with infection group, VX765 pretreatment group decreased the expression of caspase-1 protein, and the GSDMD and cleaved-GSDMD proteins also decreased. (*P< 0.05, **P< 0.01, ***P< 0.001).
Supplemental Material
Download Zip (10.5 MB)Data availability statement
The datasets generated for this study are available on request to the corresponding author.