1,791
Views
1
CrossRef citations to date
0
Altmetric
Research Paper

Multiple HA substitutions in highly pathogenic avian influenza H5Nx viruses contributed to the change in the NA subtype preference

ORCID Icon, ORCID Icon, ORCID Icon, ORCID Icon, ORCID Icon, , , , ORCID Icon, , , ORCID Icon & ORCID Icon show all
Pages 990-1004 | Received 28 Mar 2022, Accepted 23 May 2022, Published online: 05 Jun 2022

Figures & data

Figure 1. Neuraminidase (NA) selection preference of H5 viruses of clades 2.2, 2.3.4 and 2.3.4.4. an in vitro NA selection assay was utilized by applying reverse genetics to the wild-type (WT) 2.2, 2.3.4, and 2.3.4.4 H5 viruses, combined with varying internal gene cassettes (IGCs) of different viral origins and a selection of two NA genes, namely, N1 and N8. The NA selection was compared between 2.2 H5 and 2.3.4.4 H5 (a, b, and c) and between 2.3.4 H5 and 2.3.4.4 H5 (d, e, and f) in Mardin-Darby canine kidney (MDCK, i-ii) cells and chicken embryonated eggs (iii-iv). The mean δct values represent the preference for the representative NA subtype, namely, N1 or N8. The mean δct values of a minimum four determinations are presented in each graph. The error bars represent standard errors. R0: rescue supernatant; P1: cell or egg passage 1; P2: cell or egg passage 2; IGC: internal gene cassette; Ct: cycle threshold.
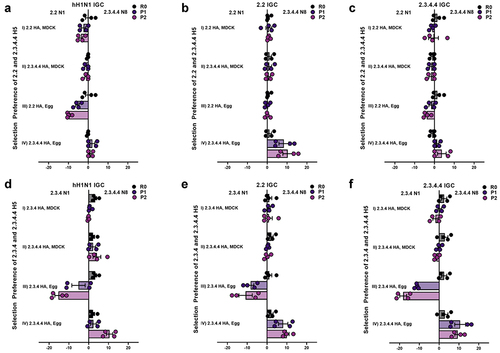
Figure 1. Neuraminidase (NA) selection preference of H5 viruses of clades 2.2, 2.3.4 and 2.3.4.4. an in vitro NA selection assay was utilized by applying reverse genetics to the wild-type (WT) 2.2, 2.3.4, and 2.3.4.4 H5 viruses, combined with varying internal gene cassettes (IGCs) of different viral origins and a selection of two NA genes, namely, N1 and N8. The NA selection was compared between 2.2 H5 and 2.3.4.4 H5 (a, b, and c) and between 2.3.4 H5 and 2.3.4.4 H5 (d, e, and f) in Mardin-Darby canine kidney (MDCK, i-ii) cells and chicken embryonated eggs (iii-iv). The mean δct values represent the preference for the representative NA subtype, namely, N1 or N8. The mean δct values of a minimum four determinations are presented in each graph. The error bars represent standard errors. R0: rescue supernatant; P1: cell or egg passage 1; P2: cell or egg passage 2; IGC: internal gene cassette; Ct: cycle threshold.

Figure 2. Sequence alignment of sequentially accrued substitutions in the H5 gene from 2005 to 2014. Haemagglutinin (HA) sequences of clade 2.3.4 and 2.3.4.4 viruses from 2005–2014 were downloaded from the influenza research database (IRD) and aligned chronologically using CLC genomics workbench 10.0.1. The seven identified conserved residues (82, 123, 156, 183, 218, 223, and 240) between 2.3.4 and 2.3.4.4 are highlighted in pink. The first protypes of 2.3.4.4 viruses isolated with the seven amino acid (AA) substitutions in their H5 genes are highlighted in yellow. Dots: unchanged residues. The reference WT viruses utilized in the study for 2.3.4 H5 (*) (A/duck/anhui/1/2006) and 2.3.4.4 H5 (**) (A/mallard/korea/w452/2014) are marked with asterisks.
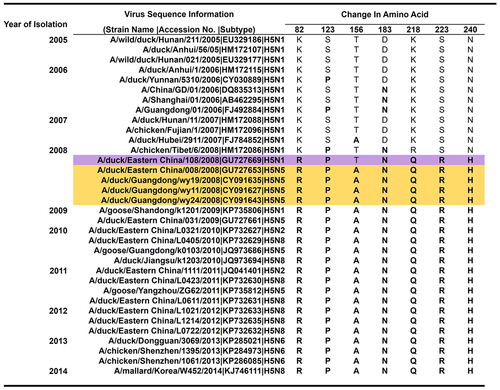
Figure 2. Sequence alignment of sequentially accrued substitutions in the H5 gene from 2005 to 2014. Haemagglutinin (HA) sequences of clade 2.3.4 and 2.3.4.4 viruses from 2005–2014 were downloaded from the influenza research database (IRD) and aligned chronologically using CLC genomics workbench 10.0.1. The seven identified conserved residues (82, 123, 156, 183, 218, 223, and 240) between 2.3.4 and 2.3.4.4 are highlighted in pink. The first protypes of 2.3.4.4 viruses isolated with the seven amino acid (AA) substitutions in their H5 genes are highlighted in yellow. Dots: unchanged residues. The reference WT viruses utilized in the study for 2.3.4 H5 (*) (A/duck/anhui/1/2006) and 2.3.4.4 H5 (**) (A/mallard/korea/w452/2014) are marked with asterisks.

Figure 3. Assessment of single or combined AA substitutions in the 2.3.4 H5 gene and its reverse substitutions in 2.3.4.4 H5 for preferential NA gene selection. Based on the sequence alignment, NA selection was carried out via single AA substitution (AAS) of the conserved mutations between 2.3.4 (a) and 2.3.4.4 (b) H5 viruses. With the observed significant reduction in fold change preference and as the last mutation introduced to 2.3.4 H5 before 2.3.4.4 emergence, T156A in combination with mutation/s, S123P/D183N/S223 R in 2.3.4 (c) and its reverse substitutions in 2.3.4.4 (d), H5 viruses were determined to show preferential NA selection between 2.3.4 N1 and 2.3.4.4 N8. With combined substitutions in the 2.3.4 and 2.3.4.4 H5 genes, NA selection was performed for the 2.3.4 and 2.3.4.4 WT versions and the 123-156-183-223 residue mutation combination against various 2.3.4.4 NA subtypes of N2 (e), N5 (f), N6 (g), and N8 (h). The mean δct values represent the preference for the representative NA subtype, N1 or N2, N5, N6, and N8. The mean δct values of three determinations are presented in each graph with error bars as standard errors. R0: rescue supernatant; E1: egg passage 1; E2: egg passage 2; Ct: cycle threshold.
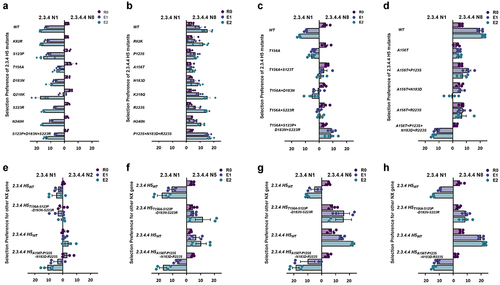
Figure 3. Assessment of single or combined AA substitutions in the 2.3.4 H5 gene and its reverse substitutions in 2.3.4.4 H5 for preferential NA gene selection. Based on the sequence alignment, NA selection was carried out via single AA substitution (AAS) of the conserved mutations between 2.3.4 (a) and 2.3.4.4 (b) H5 viruses. With the observed significant reduction in fold change preference and as the last mutation introduced to 2.3.4 H5 before 2.3.4.4 emergence, T156A in combination with mutation/s, S123P/D183N/S223 R in 2.3.4 (c) and its reverse substitutions in 2.3.4.4 (d), H5 viruses were determined to show preferential NA selection between 2.3.4 N1 and 2.3.4.4 N8. With combined substitutions in the 2.3.4 and 2.3.4.4 H5 genes, NA selection was performed for the 2.3.4 and 2.3.4.4 WT versions and the 123-156-183-223 residue mutation combination against various 2.3.4.4 NA subtypes of N2 (e), N5 (f), N6 (g), and N8 (h). The mean δct values represent the preference for the representative NA subtype, N1 or N2, N5, N6, and N8. The mean δct values of three determinations are presented in each graph with error bars as standard errors. R0: rescue supernatant; E1: egg passage 1; E2: egg passage 2; Ct: cycle threshold.

Figure 4. Invitro replication kinetics of 2.3.4 and 2.3.4.4 H5 WT viruses and viruses withHA gene mutation combinations. Based on the natural sequence of occurrence, reverse genetics (Rg) viruses, including 2.3.4/2.3.4.4 H5WT, 2.3.4/2.3.4.4 H5S123P-D183N-S223 R, and 2.3.4/2.3.4.4 H5T156A-S123P-D183N-S223 Rwith N1 or N8, were selected and evaluated for viral growth. Comparison between 2.3.4 H5 Rg viruses with N1 and N8(a, b, and c) and within 2.3.4 H5 Rg viruses with N1 (d) and N8 (e) is shown. Additionally, comparison between 2.3.4.4 H5 Rg viruses with N1 and N8 (F, G, and H)and within 2.3.4.4 H5 Rg viruses withN1 (i) and N8 (j) is shown. Eggs were infected with 102 50% egg infectious dose (Eid50), the allantoic fluid was harvested at 12,24, 36 and 48 hr post infection (hpi), and the EID50 viral titers were determined. The results presented are the mean values of 3 repetition of performed assays. The error bars represent standard errors. Significant results according to the calculated P-values (*, P≤0.05; **, P≤0.005;***, P≤0.0005; ns, P >0.05) are indicated.
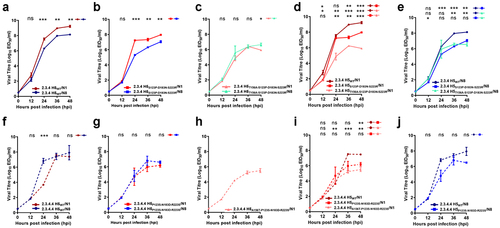
Figure 4. Invitro replication kinetics of 2.3.4 and 2.3.4.4 H5 WT viruses and viruses withHA gene mutation combinations. Based on the natural sequence of occurrence, reverse genetics (Rg) viruses, including 2.3.4/2.3.4.4 H5WT, 2.3.4/2.3.4.4 H5S123P-D183N-S223 R, and 2.3.4/2.3.4.4 H5T156A-S123P-D183N-S223 Rwith N1 or N8, were selected and evaluated for viral growth. Comparison between 2.3.4 H5 Rg viruses with N1 and N8(a, b, and c) and within 2.3.4 H5 Rg viruses with N1 (d) and N8 (e) is shown. Additionally, comparison between 2.3.4.4 H5 Rg viruses with N1 and N8 (F, G, and H)and within 2.3.4.4 H5 Rg viruses withN1 (i) and N8 (j) is shown. Eggs were infected with 102 50% egg infectious dose (Eid50), the allantoic fluid was harvested at 12,24, 36 and 48 hr post infection (hpi), and the EID50 viral titers were determined. The results presented are the mean values of 3 repetition of performed assays. The error bars represent standard errors. Significant results according to the calculated P-values (*, P≤0.05; **, P≤0.005;***, P≤0.0005; ns, P >0.05) are indicated.

Figure 5. Glycoprotein activities of the 2.3.4 H5 WT virus and viruses with H5 gene mutation combinations. Based on the natural sequence of occurrence, reverse genetics (Rg) viruses, including 2.3.4/2.3.4.4 H5WT, and 2.3.4/2.3.4.4 H5 combination mutants with N1 or N8, were selected and evaluated for their HA and NA activities. In addition, the HA receptor binding affinity of 2.3.4 H5WT, 2.3.4 H5S123P-D183N-S223 R, and 2.3.4 H5T156A-S123P-D183N-S223 R with N1 or N8 was measured using α2,3 biotinylated glycans using HA direct binding assay read at OD 450 nm. A comparison of HA receptor binding affinity between 2.3.4 H5 Rg viruses with N1 and N8 (a, b and c) and within 2.3.4 H5 Rg viruses with N1 (d) and N8 (e) is shown. NA activity of 2.3.4 H5WT, 2.3.4 H5S123P-D183N-S223 R, and 2.3.4 H5T156A-S123P-D183N-S223 R with N1 or N8 was also determined through a chemiluminescence assay read at OD 492 nm. Comparison of NA activity between 2.3.4 H5 Rg viruses with N1 and N8 (F, G, and H) and within 2.3.4 H5 Rg viruses with N1 (I) and N8 (J) is shown. The results presented are the mean values of a minimum of 3 repetitions of performed assays.
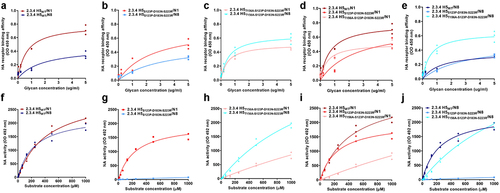
Figure 5. Glycoprotein activities of the 2.3.4 H5 WT virus and viruses with H5 gene mutation combinations. Based on the natural sequence of occurrence, reverse genetics (Rg) viruses, including 2.3.4/2.3.4.4 H5WT, and 2.3.4/2.3.4.4 H5 combination mutants with N1 or N8, were selected and evaluated for their HA and NA activities. In addition, the HA receptor binding affinity of 2.3.4 H5WT, 2.3.4 H5S123P-D183N-S223 R, and 2.3.4 H5T156A-S123P-D183N-S223 R with N1 or N8 was measured using α2,3 biotinylated glycans using HA direct binding assay read at OD 450 nm. A comparison of HA receptor binding affinity between 2.3.4 H5 Rg viruses with N1 and N8 (a, b and c) and within 2.3.4 H5 Rg viruses with N1 (d) and N8 (e) is shown. NA activity of 2.3.4 H5WT, 2.3.4 H5S123P-D183N-S223 R, and 2.3.4 H5T156A-S123P-D183N-S223 R with N1 or N8 was also determined through a chemiluminescence assay read at OD 492 nm. Comparison of NA activity between 2.3.4 H5 Rg viruses with N1 and N8 (F, G, and H) and within 2.3.4 H5 Rg viruses with N1 (I) and N8 (J) is shown. The results presented are the mean values of a minimum of 3 repetitions of performed assays.

Figure 6. Antigenic drift of 2.3.4 and 2.3.4.4 H5 Rg viruses demonstrated recognition by specific 2.3.4 and 2.3.4.4 H5WTanti-sera. Antigenic differences between the groups of Rg viruses, including both the WT 2.3.4 and 2.3.4.4 H5 and single- or multiple-mutant viruses with N1 or N8 are shown through an antigenic map generated using hemagglutination inhibition (HI) titers derived from recognition of specific anti-sera for the WT 2.3.4 H5N1 and 2.3.4.4 H5N8 HA proteins (Table S3). The antigenic cartography map was constructed using the constructed HI matrices with the subsets of viruses against the two anti-sera normalized by low-rank matrix completion. Using multidimensional scaling in the R program, the viruses were projected into a 2D map wherein each grid line (horizontal and vertical) in the map represents a distance of one antigenic unit (AU), corresponding to a 2-fold difference in HI titers. The Euclidean distances corresponding to the antigenic distance differences among the viruses were calculated and are presented in Table S4.
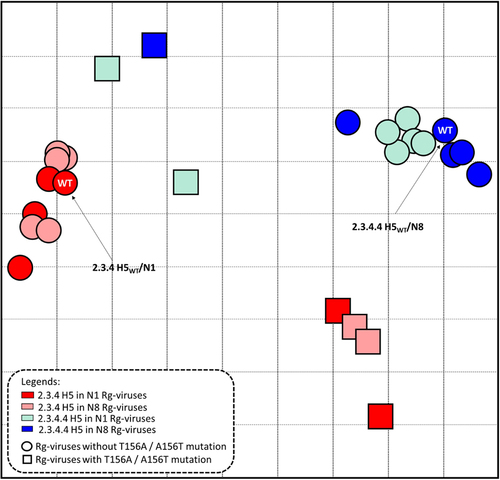
Figure 6. Antigenic drift of 2.3.4 and 2.3.4.4 H5 Rg viruses demonstrated recognition by specific 2.3.4 and 2.3.4.4 H5WTanti-sera. Antigenic differences between the groups of Rg viruses, including both the WT 2.3.4 and 2.3.4.4 H5 and single- or multiple-mutant viruses with N1 or N8 are shown through an antigenic map generated using hemagglutination inhibition (HI) titers derived from recognition of specific anti-sera for the WT 2.3.4 H5N1 and 2.3.4.4 H5N8 HA proteins (Table S3). The antigenic cartography map was constructed using the constructed HI matrices with the subsets of viruses against the two anti-sera normalized by low-rank matrix completion. Using multidimensional scaling in the R program, the viruses were projected into a 2D map wherein each grid line (horizontal and vertical) in the map represents a distance of one antigenic unit (AU), corresponding to a 2-fold difference in HI titers. The Euclidean distances corresponding to the antigenic distance differences among the viruses were calculated and are presented in Table S4.

Figure 7. Structural modeling of 2.3.4 Rg viruses with WT H5 and HA with combination mutations. (A) Docking model of the influenza a HA trimer and NA tetramer. (B) Predicted contact regions (dashed line) for docked structures identified in HA (protein data bank (PDB) id: 4bh0) (cyan) and NA (PDB id: 6crd) (purple) using the ZDOCK server. The glycan-binding sites are colored bright orange (HA), magenta, and purple (both in NA). The contact region in HA is colored pale cyan. The identified NA contact site also overlaps with a sialic acid-binding site. Among the four identified mutations in 2.3.4 H5, S123P and T156A (red) are located near the contact interface. (C) the HA-NA contact interface in the docking model and the site of glycan binding are presented in detail, with glycans shown as sticks. (D) Details regarding the four mutation sites in 2.3.4 H5 identified in this study, which are shown as blue sticks in their respective loop (thick yellow) locations. A phosphate molecule (orange spheres) is depicted between the loops near residues S123 and T156 in the WT structure of HA. AA substitutions of S123 and T156 to pro and ala, respectively, leading to the loss of phosphate molecules that may have elicited conformational changes affecting the stability and flexibility of these loops and the overall interaction with NA. All images were generated using PyMOL.
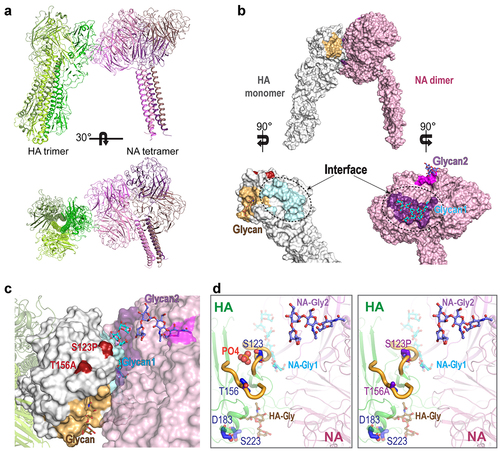
Figure 7. Structural modeling of 2.3.4 Rg viruses with WT H5 and HA with combination mutations. (A) Docking model of the influenza a HA trimer and NA tetramer. (B) Predicted contact regions (dashed line) for docked structures identified in HA (protein data bank (PDB) id: 4bh0) (cyan) and NA (PDB id: 6crd) (purple) using the ZDOCK server. The glycan-binding sites are colored bright orange (HA), magenta, and purple (both in NA). The contact region in HA is colored pale cyan. The identified NA contact site also overlaps with a sialic acid-binding site. Among the four identified mutations in 2.3.4 H5, S123P and T156A (red) are located near the contact interface. (C) the HA-NA contact interface in the docking model and the site of glycan binding are presented in detail, with glycans shown as sticks. (D) Details regarding the four mutation sites in 2.3.4 H5 identified in this study, which are shown as blue sticks in their respective loop (thick yellow) locations. A phosphate molecule (orange spheres) is depicted between the loops near residues S123 and T156 in the WT structure of HA. AA substitutions of S123 and T156 to pro and ala, respectively, leading to the loss of phosphate molecules that may have elicited conformational changes affecting the stability and flexibility of these loops and the overall interaction with NA. All images were generated using PyMOL.
Supplemental material

Supplemental Material

Download PDF (1.5 MB)