
Figures & data
Figure 1. Chemical structure of selected steroidal compounds. (a) Chemical structures of dexamethasone and progesterone, which are currently used or evaluated, respectively, in clinical settings for treating COVID-19; (b) Chemical structures of epiandrosterone (EA) derivatives evaluated in this study. Compounds showing high to moderate SARS-CoV-2 CPE inhibition are highlighted in green rectangles and the best compounds, LNB167 and LNB169 are highlighted in a red rectangle.
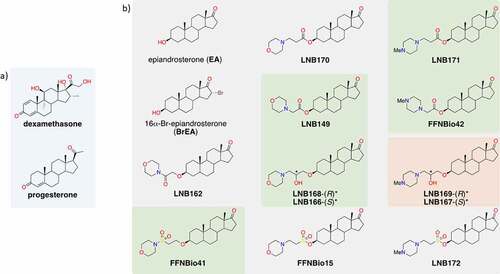
Figure 2. Identification of steroidal compounds with anti-SARS-CoV-2 properties in vitro. (a) Correlation plot between two independent runs of the SARS-CoV-2 mediated cytopathic effect (CPE) in Vero cells assay. Control groups were defined by non-infected (blue circles) and infected (red circles) cells. Among the twelve assayed compounds (green circles), five promoted a significant cellular protective effect and were selected as hit candidates (labeled samples). (b) Half maximal effective concentration (EC50) (green bar) was calculated based on 50% CPE inhibition and half maximal cytotoxic concentration (CC50) (gray bar) corresponds to the compound concentration that causes 50% of cytotoxicity in non-infected cells. Dots represent mean of triplicates in one experiment. Bars represent 3 independent experiments. (c) SARS-CoV-2 infectious viral particles quantification in Vero cells supernatant infected with or without treatment by plaque assay titration. (d) SARS-CoV-2 RNA quantification by RT-qPCR in supernatant of infected cells with or without treatment. *p < 0.05, **p < 0.01, ***p < 0.001 relative to the virus-infected, vehicle-treated control group. Vehicle = DMSO. Data representative of 2 independents experiments. n = 3 per experiment.
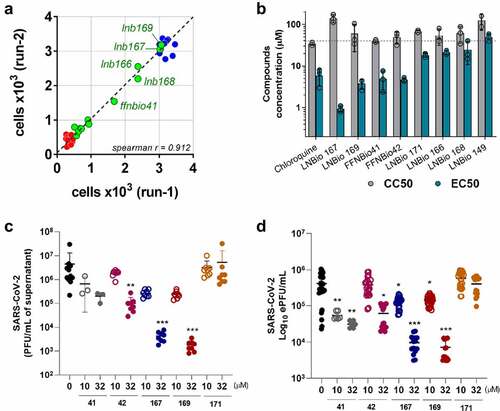
Figure 3. LNB167 and LNB169 have antiviral effects against SARS-CoV-2 in different cell lines. (a, b) Quantification of SARS-CoV-2 infectious viral particles in the supernatant of different cell lines (HEK293T and HuH7.5) infected with SARS-CoV-2 with or without treatment, using plaque assays. (c, d) Viral RNA measured by RT-qPCR in supernatant of cell cultures of different cell lines infected with or without LNBio167 and LNB169 treatment. *p < 0.05, **p < 0.01, ***p < 0.001 relative to the virus-infected, vehicle-treated control group. Vehicle = DMSO. Data representative of 2 independent experiments (n = 6).
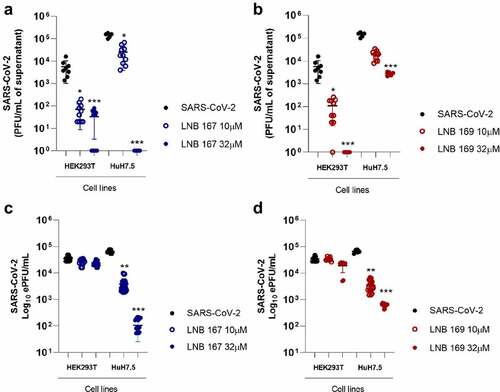
Figure 4. LNB167 and LNB169 act in early stage of replication cycle of SARS-CoV-2. (a) Titer of SARS-CoV-2 infectious viral particles measured after 24 h in Vero infection and treatment with LNB167 and LNB169 (32 µm). (b) SARS-CoV-2 RNA quantification by RT-qPCR in supernatant of Vero cells infected. (c) Compounds LNB167 and LNB169 were incubated with SARS-CoV-2 stock samples for 2 h at the concentration of 32 µm and later submitted to a plaque assay for quantification of infectious viruses in Vero CCL81 cells. Virus samples incubated with vehicle (DMSO) in cell culture media was included as a control. Results are expressed as PFU/mL of cell culture supernatant. p < 0.05, **p < 0.01, ***p < 0.001 in comparison an infected non-treated group. n = 4 for each time point.
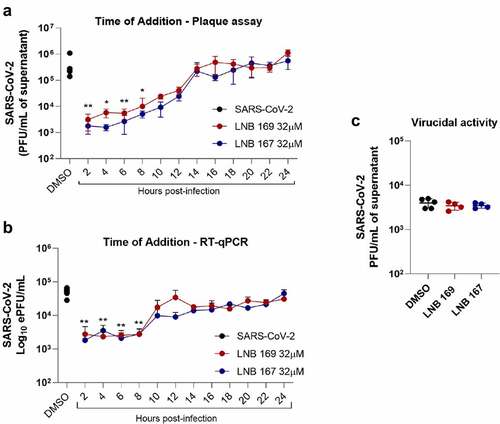
Figure 5. In vitro induction of LNB167 and LNB169-resistant SARS-CoV-2 variants. (a) Illustration of the serial passage program used to select LNB167 or LNB169-resistant SARS-CoV-2 variants in Vero CCL81 cells. (b) Titration of infectious viral particles of SARS-CoV-2 cultured in presence of LNB167 (blue circles) and LNB169 (red circles). Control infected non-treated group (black circle). Vehicle: DMSO. (c) Cross protection assay between SARS-CoV-2 169 R and treatment with LNB167 (32 µm). Infectious particles measured in supernatant of Vero cells infected with MOI of 0.01 after 48 h. Control SARS-CoV-2 B.1 infected non-treated (black circles); Control SARS-CoV-2 B.1 infected treated with LNB169 32 µm (red circle); Control SARS-CoV-2 infected treated with LNB167 32 µm (blue circle); Experimental group of resistant variant 169 R treated with LNB169 32 µm (red hollow upward triangle); Experimental group of resistant variant with 169 R infection and cross protect treatment with LNB167 32 µm (red hollow downward triangle). p < 0.05, **p < 0.01, ***p < 0.001 groups compared with control infected non-treated group (black circle).
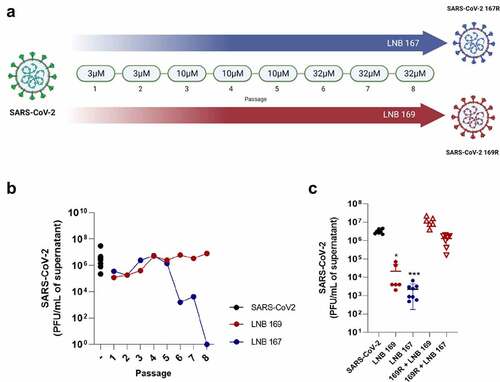
Figure 6. SARS-CoV-2 169R and 167R present single nucleotide mutations leading to amino acid substitutions in structural proteins. Genome sequencing from both SARS-CoV-2 and drug resistant variants showed that 169R and 167R present single nucleotide mutations. Mutation S813I is shown in 169R Spike protein S2 subunit, only 3 residues ahead of the internal fusion peptide. Variant 167R has a T30I mutation in its Envelope protein. Schemes indicate the mutation sites presented by each variant along their genomes and proteins. Structures from SARS-CoV-2 spike (entry: P0DTC2) and envelope proteins (entry: P0DTC4) were obtained at Protein Data Bank (PDB). Red dots represent hydrophobic amino acids, and blue dots represents hydrophilic amino acids.
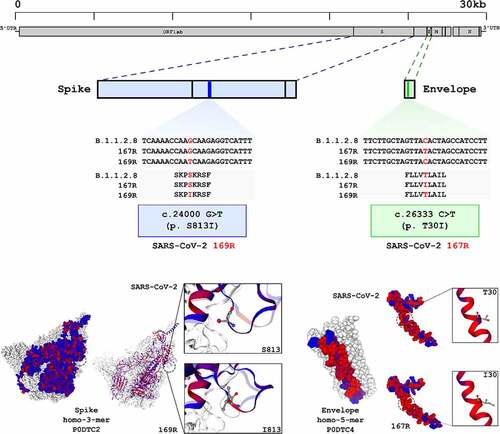
Figure 7. Treatment with LNB167 modulates lipid membrane and cholesterol metabolism. HEK293T cells were infected with SARS-CoV-2 and treated or not with LNB167 at 32 µm and collected at 48 h p.I. For RNASeq analysis. Non-infected (NI) HEK293T cells treated or not with LNB167 were included as controls. Gene expression data were analyzed using DESeq2 and Metacore in search of significant genes and pathways that were significantly up or downregulated in the tested conditions. (a) Principal Component Analysis (PCA) depicting global transcriptional profiles of tested conditions. (b) Enriched biological processes GO terms within upregulated genes in SARS-CoV-2 infected cells in comparison to NI cells (c) Enriched biological processes GO terms within upregulated genes in LNB167- treated cells in comparison to vehicle-treated cells (NI). (d) Enriched biological processes GO terms within upregulated genes in SARS-CoV-2 infected cells treated with LNB167 compared to vehicle-treated infected cells (NI). E) Immunostaining experiment in which Vero CCL81 cells were infected or not with SARS-CoV-2 and treated with U18666A, a cholesterol intracellular transport inhibitor, or LNB167 at 32 µm or 10 µm. Nuclei were stained with SYBR Safe dye (seen in green), and cholesterol was stained with filipin reagent, in blue. Bright blue granules represent accumulated cholesterol in cells.
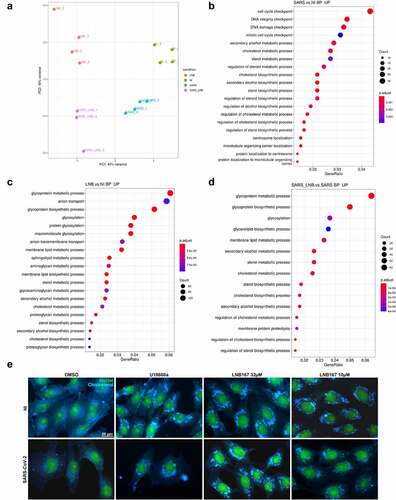
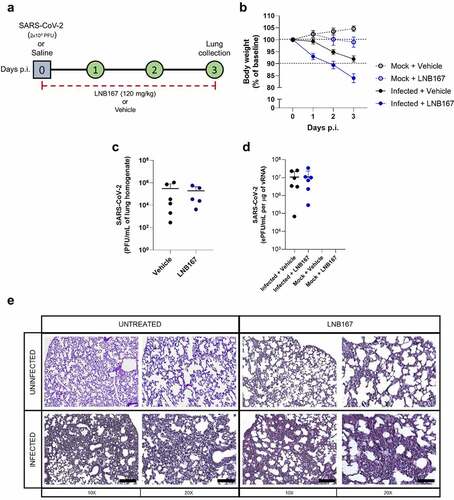
Figure 8. Treatment with LNB167 was not protective in the hACE2-transgenic mouse model of SARS-CoV-2 infection. K18-hACE2 TG mice were inoculated with SARS-CoV-2 (2x10⁴ PFU/40 µl) or saline by intranasal route. Infected or uninfected animals were treated with LNB167 (120 mg/kg) or vehicle once daily from day 0 to day 3 p.I. Lungs were collected on day 3 p.I. And viral titration was performed by either (a) virus plaque forming assay or (b) RT-qPCR. (c) Body weight was evaluated daily. (d) 5-µm lung slices from mice euthanized 3 days p.I. were stained with H&E for histology assessment. Bar scales = 10x −250 µm; 20x −125 µm.
Supplemental Material
Download PDF (2.5 MB)Data availability statement
The authors confirm that the data supporting the findings of this study are available within the article [and/or] its supplementary materials.