
Figures & data
Figure 1. Overview of the study and experiment design.
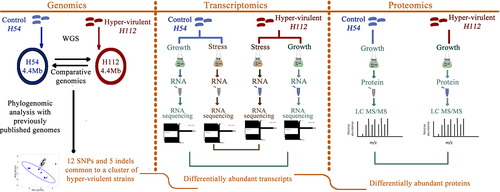
Figure 2. Consistent differential gene expression in H112 across 7H9 (nutrient-rich) and NR (stress) medium conditions relative to H54.
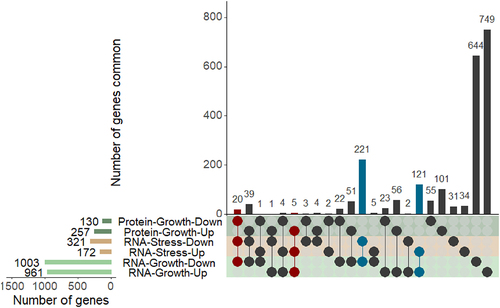
Figure 3. An integrated analysis of genomic, transcriptomic, and proteomic differences between hyper-virulent strain H112 and phylogenetically related low-virulent strain H54.
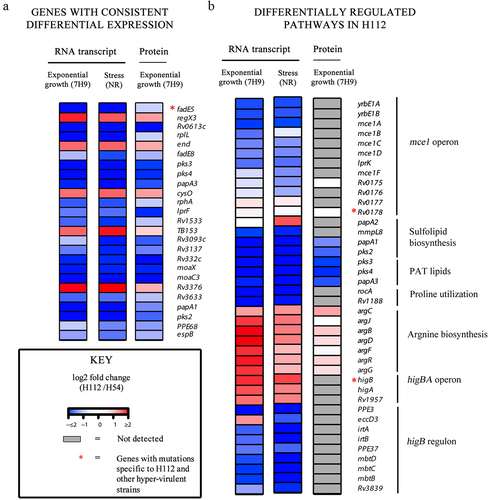
Table 1. Associations between genetic mutations in the hyper-virulent strain and differential gene expression.
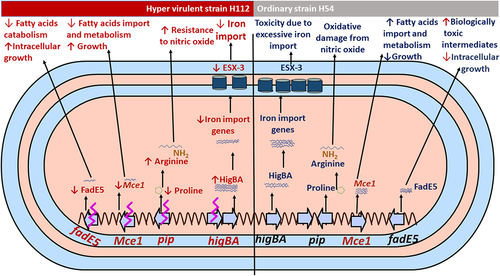
Figure 4. Proposed mechanisms of hyper-virulence in the clinical strain H112 compared to low-virulent strain H54.
Supplemental Material
Download MS Word (584.4 KB)Data availability statement
The raw data of RNA seq and LC-MS/MS and the expression differences for each gene between hyper-virulent strain H112 and ordinary virulent strain H54 can be accessed through https://www.ncbi.nlm.nih.gov/geo/query/acc.cgi?acc=GSE203662 (RNA) and https://doi.org/10.1080/21505594.2022.2087304 (Protein).