
Figures & data
Figure 1. Biological characteristics of Bacillus cereus MB1. (a) MB1 colonies on Marine 2216EA plate. (b) MB1 spores stained with malachite green and safranine. (c and d) MB1 observed with scanning (c) and transmission (d) electron microscopes. (e) Growth of MB1 on marine 2216E containing 0.3 (w/v) agar. For panels b, c, and d, the scale bar is 2 μm.
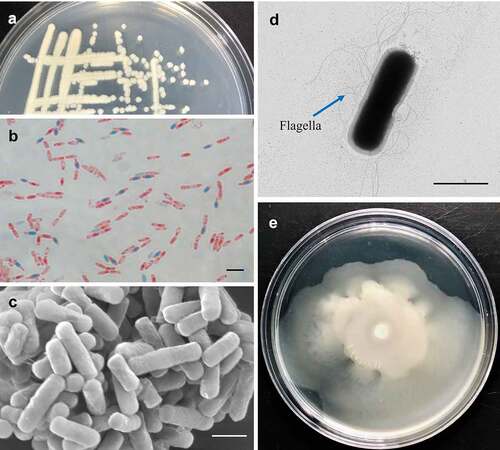
Figure 2. Circular maps of Bacillus cereus MB1. Circular maps of MB1 chromosome (a), pMb1a (b), and pMb1b (c) are shown. The scales on the outside circles indicate the coordinates of the genome/plasmids. The circles from outside to inside represent the following: COG annotated genes, KEGG annotated genes, GO annotated genes, ncRNA, GC content, and GC skew. Gray represents unannotated genes.
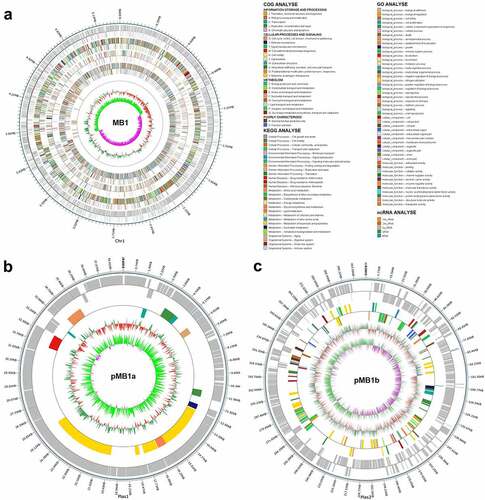
Table 1. The general genome features of Bacillus cereus MB1 in comparison with that of ATCC 14579.
Figure 3. Comparative genomic analysis of MB1 and ATCC 14579. (a) Alignment of the genomes of MB1 and ATCC 14579. (b) a Venn diagram showing the shared and unique genes of MB1 and ATCC 14579. (c) the numbers of MB1- and ATCC 14579-specific genes assigned to the COG categories. (d) the comparison of the 10 plasmid-encoded virulence genes of MB1 with their closest homologues in other Bacillus. Grey represents absence of the gene in the genome. Color transition from blue to red represents increasing percentage of identity from 25% to 100%.
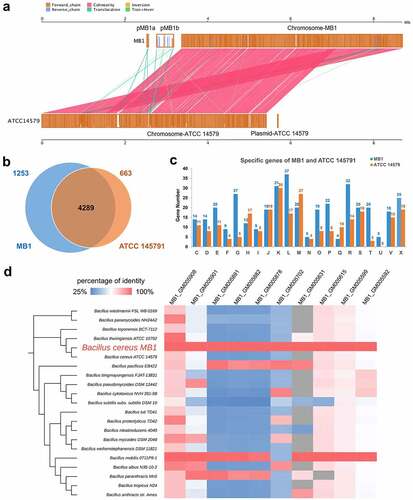
Figure 4. Pathogenicity of MB1 to turbot and mice. (a, b) Turbot (a) and mice (b) were infected with or without (Ctrl) MB1 for 24 h and 2 h, respectively, and observed for clinical symptoms. (c) Tissues from MB1-infected moribund mice and uninfected mice were examined. (d, e) Turbot (d) and mice (e) were inoculated with MB1, and bacterial numbers (shown as colony forming unit, CFU) in the liver, spleen, and kidney were determined at 12, 24, and 28 h (turbot) or 3 h (mice) post-infection. The results are the means of triplicate experiments and shown as means ± SD.
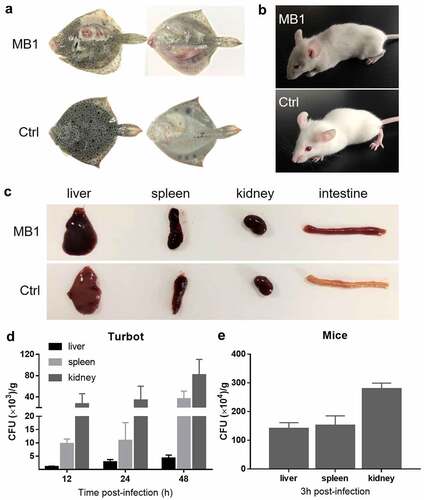
Figure 5. Cytotoxicity of MB1. (a) J774A.1 cells were incubated with MB1 or Bacillus cereus ATCC 14579 for 2 h at a multiplicity of infection (MOI) of 0 to 10, and then measured for lactate dehydrogenase (LDH) release. Data are the means of triplicate experiments and shown as means ± SD. ** p < 0.01 (Student’s t test). (b) Hemolytic activity of MB1. a, PBS (control); b, 2% TritonX-100; c, MB1 suspension; d, MB1 supernatant. (c) the supernatants of MB1 and ATCC 14579 were collected at different times of culturing and incubated with J774A.1 (5% v/v) for 2 h. LDH release was then measured. Data are the means of triplicate experiments and shown as means ± SD.
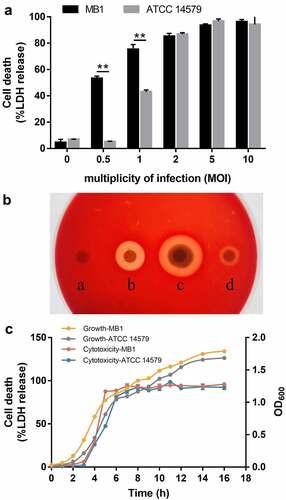
Figure 6. Cell death induced by MB1 and its culture supernatant at different doses. (a, b) Time-lapse images of HeLa cells treated with MB1 (MOI = 1) (A) or its supernatant (5%) (B). Red arrows indicate bubbled cells. (c) HeLa cells were incubated with or without (Ctrl) MB1 (MOI = 1 or 5) or MB1 supernatant (sup.) (5% or 25%) for 2 h and observed with a microscope. For panels a to c, the scale bar is 30 μm.
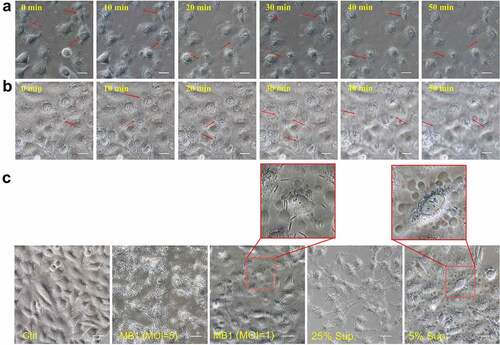
Figure 7. MB1 and its culture supernatant induce pyroptosis at low doses. (a) J774A.1 cells were primed with LPS and infected with or without (Ctrl) MB1 (MOI = 1) or the supernatant (Sup.) (5% v/v) for 2 h. The cell lysate and culture supernatant were immunoblotted with antibodies against caspase-1 (Casp1), GSDMD, or β-actin (loading control). (b, c) LPS-primed J774A.1 cells were infected with or without (Ctrl) MB1 or the supernatant (5% or 25%) or treated with ATP for 2 h, and the release of IL-1β (B) and IL-18 (c) was measured. Values are shown as means ± sd (N = 3). N, the number of replicates. ** p < 0.01 (Student’s t test). NS, no significance. (d) LPS-primed J774A.1 cells were infected with or without (Ctrl) MB1 or the supernatant (5%) for 2 h or 3 h, and then observed with a scanning electron microscope. (e) LPS-primed HeLa cells were infected with or without (Ctrl) MB1 or the supernatant (5%) for 3 h. The cells were stained with Annexin V-FITC/PI and observed with a confocal microscope.
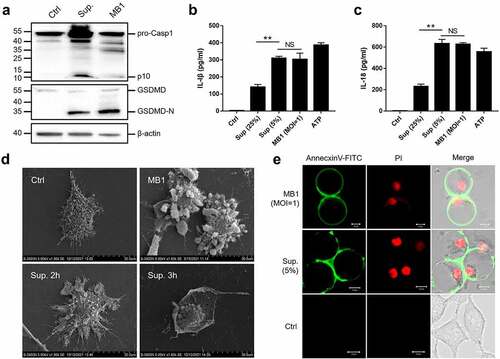
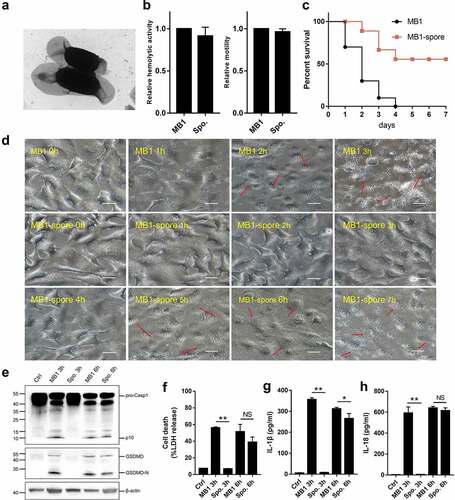
Figure 8. Pathogenicity of MB1 spores. (a) MB1 spores observed with a transmission electron microscope. (b) the swimming and haemolytic abilities of MB1 spores in comparison with that of MB1. (c) Turbots were infected with MB1 or the spores, and the survival of the fish was monitored for 7 days. (d) HeLa cells were incubated with MB1 or the spores (MOI = 1) for different hours and observed with a microscope. Red arrows indicate pyroptotic cells. The scale bar is 30 μm. (e – h) J774A.1 cells were infected with or without (Ctrl) MB1 or the spores (MOI = 1) for 3 or 6 h. The cell lysate and culture supernatant were mixed and immunoblotted with antibodies against caspase-1 (Casp1), GSDMD, or β-actin (loading control) (e). Release of lactate dehydrogenase (LDH) (f), IL-1β (g), and IL-18 (h) was measured. For panels b, f, g, and h, values are shown as means ± sd (N = 3). N, the number of replicates. ** p < 0.01, * p < 0.05 (Student’s t test). NS, no significance.
Supplemental Material
Download MS Word (825.2 KB)Data availability statement
The datasets generated for this study can be found in the GenBank accession numbers CP091971, CP091972 and CP091973.