
Figures & data
Figure 1. Overview of the RNA sequencing experiment. Stationary phase, luminescent C. glabrata cells were injected directly into the bladder of immunocompetent mice via a catheter. At day 3 post infection, bioluminescence was measured and highly infected mice were selected for RNA extraction and processed up to RNA sequencing.
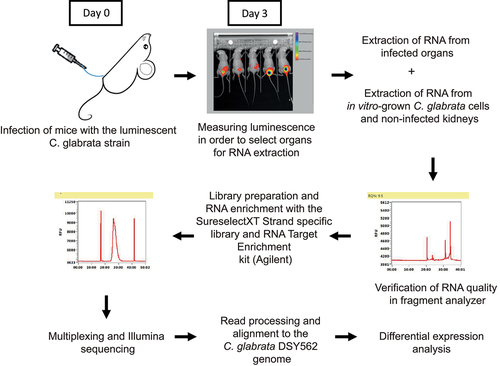
Figure 2. RNA enrichment validity and differential expression between in vivo and in vitro conditions. (a) Quality of enrichment was assessed by correlating the normalized read counts of the enriched in vitro samples (enriched from a mix with RNA from a non-infected kidney) and the non-enriched in vitro samples. Red-labelled data points indicate enrichment bias. (b) Differential expression diagram: more than 1000 genes are up- and downregulated (Log2(fc) ≥1 and ≤1) compared to in vitro conditions. FC: fold-change.
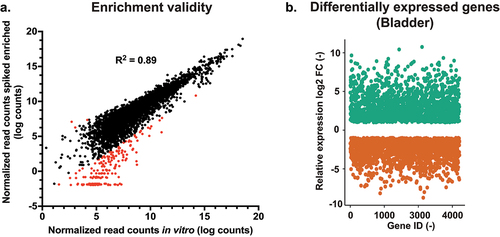
Table 1. Enrichment efficiency for infected organs and spiked samples.
Figure 3. (a) GSEA (Gene set enrichment analysis) of C. glabrata genes regulated in vivo. The gene list was produced from data in file S4 (“Cg14.Gmt”), in which genes with P values of ≤0.05 and log fold-change ≥ 2 (in vivo compared to in vitro) were chosen. The Cg14.Gmt file contains 167 differential expression data sets from published transcriptional data performed with C. glabrata. The list was then imported into the GSEA software 4.10. Analysis parameters were as follows: norm, meandiv; scoring_scheme, weighted; set_min, 15; nperm, 1000; set_max, 500. GSEA results were uploaded into cytoscape 3.0 with the following parameters: P value cut-off, 0.01; FDR q value, 0.05. Red nodes represent enriched gene lists in upregulated genes from the GSEA. Blue nodes represent enriched gene lists in downregulated genes from the GSEA. Nodes are connected by edges when overlaps exist between nodes. The size of nodes reflects the total number of genes that are connected by edges to neighbouring nodes. Edge thickness reflects the level of confidence between nodes. Labels of nodes indicate specific classes of genes listed in the Cg14.Gmt file. (b) and (c) KEGG pathway enrichment of C. glabrata genes up- and down regulated regulated in vivo, respectively. The enrichment analysis was performed with the online tool ShinyGO (http://bioinformatics.Sdstate.edu/go/) [Citation42] with a filtered C. glabrata gene list of up- and down-regulated genes (log2(fc) ≥ 2 compared to in vitro growth)
![Figure 3. (a) GSEA (Gene set enrichment analysis) of C. glabrata genes regulated in vivo. The gene list was produced from data in file S4 (“Cg14.Gmt”), in which genes with P values of ≤0.05 and log fold-change ≥ 2 (in vivo compared to in vitro) were chosen. The Cg14.Gmt file contains 167 differential expression data sets from published transcriptional data performed with C. glabrata. The list was then imported into the GSEA software 4.10. Analysis parameters were as follows: norm, meandiv; scoring_scheme, weighted; set_min, 15; nperm, 1000; set_max, 500. GSEA results were uploaded into cytoscape 3.0 with the following parameters: P value cut-off, 0.01; FDR q value, 0.05. Red nodes represent enriched gene lists in upregulated genes from the GSEA. Blue nodes represent enriched gene lists in downregulated genes from the GSEA. Nodes are connected by edges when overlaps exist between nodes. The size of nodes reflects the total number of genes that are connected by edges to neighbouring nodes. Edge thickness reflects the level of confidence between nodes. Labels of nodes indicate specific classes of genes listed in the Cg14.Gmt file. (b) and (c) KEGG pathway enrichment of C. glabrata genes up- and down regulated regulated in vivo, respectively. The enrichment analysis was performed with the online tool ShinyGO (http://bioinformatics.Sdstate.edu/go/) [Citation42] with a filtered C. glabrata gene list of up- and down-regulated genes (log2(fc) ≥ 2 compared to in vitro growth)](/cms/asset/77d57430-be0e-46fa-9944-d8169a9e8ecd/kvir_a_2095716_f0003_oc.jpg)
Table 2. In vivo expression of the YPS genes.
Table 3. In vivo expression of adhesin genes.
Figure 4. Deletion of DUR1,2 strongly impairs growth on urea as the sole nitrogen source, as well as virulence in the urinary tract. (a) Serial dilutions of each strain were spotted on nitrogen starvation (NS) medium, containing 0.5% urea as the sole nitrogen source and grown for 4 days at 30°C. (b) Ten mice per group were infected with either the wild type or the mutant strain, by injection (through a catheter) into the bladder. On day 3 post infection, animals were euthanized and bladders, kidneys and spleens were collected for quantification of the fungal burden. (Significance symbols: **** p < 0.0001, *** 0.0001 < p < 0.0001, ** 0.001 < p < 0.01, * 0.01 < p < 0.05).
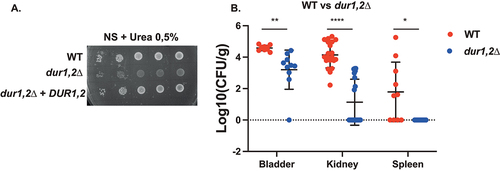
Figure 5. Deletion of GAP1 strongly impairs growth on citrulline or tryptophan as the sole nitrogen source, as well as virulence in the urinary tract. (a) Serial dilutions of each strain were spotted on nitrogen starvation (NS) medium, containing 5 mM of either L-citrulline or L-tryptophan as the sole nitrogen source and grown for 4 days at 30°C. (b) Ten mice per group were infected with either the wild type or the mutant strain, by injection (through a catheter) into the bladder. On day 3 post infection, animals were euthanized and bladders, kidneys and spleens were collected for quantification of the fungal burden. (Significance symbols: **** p < 0.0001, *** 0.0001 < p < 0.0001, ** 0.001 < p < 0.01, * 0.01 < p < 0.05).
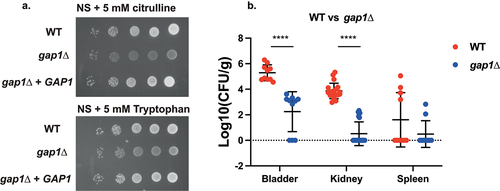
Figure 6. Deletion of MLS1 abolishes growth on acetate or ethanol as the sole carbon source, as well as virulence in the urinary tract. (a) Serial dilutions of each strain were spotted on minimal medium (YNB), containing 2% of either acetate or ethanol as the sole carbon source and grown for 6 days at 30°C. (b) Ten mice per group were infected with either the wild type or the mutant strain, by injection (through a catheter) into the bladder. On day 3 post infection, animals were euthanized and bladders, kidneys and spleens were collected for quantification of the fungal burden. (Significance symbols: **** p < 0.0001, *** 0.0001 < p < 0.0001, ** 0.001 < p < 0.01, * 0.01 < p < 0.05).
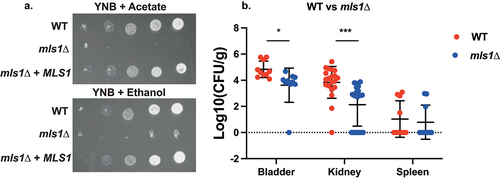
Figure 7. Deletion of VMA22 results in decreased virulence in the urinary tract, even though no strong growth defects were found in vitro. (a) Serial dilutions of each strain were spotted on minimal medium (YNB), containing 2% ethanol as the sole carbon source and grown for 6 days at 30°C. (b) Ten mice per group were infected with either the wild type or the mutant strain, by injection (through a catheter) into the bladder. On day 3 post infection, animals were euthanized and bladders, kidneys and spleens were collected for quantification of the fungal burden. (Significance symbols: **** p < 0.0001, *** 0.0001 < p < 0.0001, ** 0.001 < p < 0.01, * 0.01 < p < 0.05).
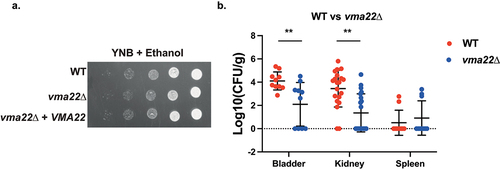
Table 4. Comparison between most highly significantly upregulated genes in C. albicans invasive infection vs C. glabrata UTI.
Table 5. Comparison between strongest upregulated genes in C. glabrata UTI (kidneys) vs C. albicans invasive infection.
Figure 8. In vivo regulation of C. albicans and C. glabrata orthologs. The orthologs between both species were obtained from the public Candida genome database. The C. albicans RNAseq data were obtained from the work of Amorim-Vaz et al. [Citation30] taking the 16 h time point of mice infection. The C. glabrata RNAseq data were from infected kidneys (File S5). Data were filtered by p-value (<0.05).
![Figure 8. In vivo regulation of C. albicans and C. glabrata orthologs. The orthologs between both species were obtained from the public Candida genome database. The C. albicans RNAseq data were obtained from the work of Amorim-Vaz et al. [Citation30] taking the 16 h time point of mice infection. The C. glabrata RNAseq data were from infected kidneys (File S5). Data were filtered by p-value (<0.05).](/cms/asset/23c4c1c8-162e-4eee-8859-57c948d30b22/kvir_a_2095716_f0008_b.gif)
Supplemental Material
Download Zip (11.4 MB)Data availability statement
The authors confirm that the data supporting the findings of this study are available within the article and its supplementary materials.