
Figures & data
Figure 1. Comparison of P. intermedia strains grown in liquid medium. In the cultures of Pi17, viscous materials with fine fibrous structures that formed into bundles were observed. On the other hand, such viscous materials were not observed in the culture supernatants of the other strains.The bacterial cells were grown in B-HK medium for 24 h at 37°C anaerobically (80% N2, 10% H2, 10% CO2).
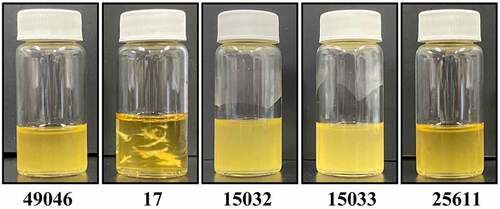
Figure 2. In vivo virulence of P. intermedia strains. (a) Galleria mellonella infection model. Larvae weighed between 170 and 220 mg at time of inoculation. Bacterial cell suspensions (2 × 10⁷ CFU/larva) of each strain were injected into the larvae. Survival was monitored daily for 72 h and larval death was confirmed by the lack of touch-induced movement. Images are representative of three independent experiments. (b) Murine skin infection model. Male BALB/c mice (4 weeks old; 5 mice per strain) were used. Bacterial cell suspension (5 × 10⁹ CFU/mouse) of each strain was injected into the inguinal area of each mouse to induce abscess.
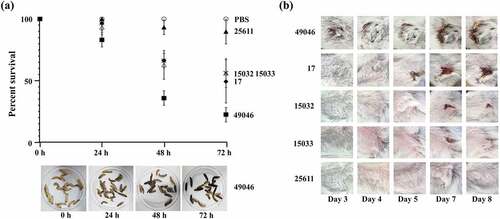
Figure 3. Comparative genomic analysis of five P. intermedia strains. (a) Genome sequence similarity performed by BRIG. Whole genome pairwise alignments were performed using MUMmer. Numbers in red and blue (in the table) represent the similarities between two genomes in forward and reverse direction, respectively. (b) Pangenome analysis using PGAP method. Pangenome gene clusters in intersections are shown as filled (black) circles and the number of clusters is presented in the bar plot above.
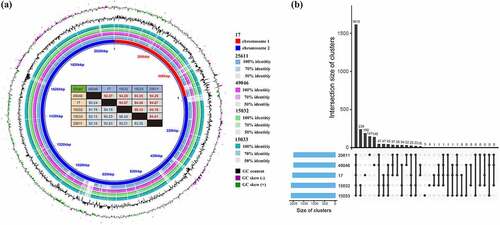
Table 1. Inter-strain genetic variations associated with glycosylation, nutrient acquisition and transcriptional regulation.
Figure 4. Phosphoglycosyltransferases (PGTs) of P. intermedia. (a) Phylogenetic analysis using 61 PGTs of 31 strains of P. intermedia. All but one strain (KCOM 1779) harbour two PGTs. The two virulent strains Pi49046 and Pi17 carry PGT belonging to clade B (green lines), while the other three strains (Pi15032, Pi15033 and Pi25611) carry PGT belonging to clade A (red lines). (b) Multiple sequence alignment using PGTs of P. intermedia with well-known PGT subfamilies (PglC and PglB). (c) Phylogenetic tree based on PGT was constructed using multiple sequence alignment. (d) Structural model of PGTs. C. concisus PGT (PDB ID 5W7 L, chain A) was used as the structural template for modelling. Additional loop regions in Pi49046 PGT and Pi17 PGT were coloured as blue and red, respectively. Structurally conserved regions were represented using green colour. Magenta stick configuration residues (K59, D93, E94 and R112) represents the conserved active sites.
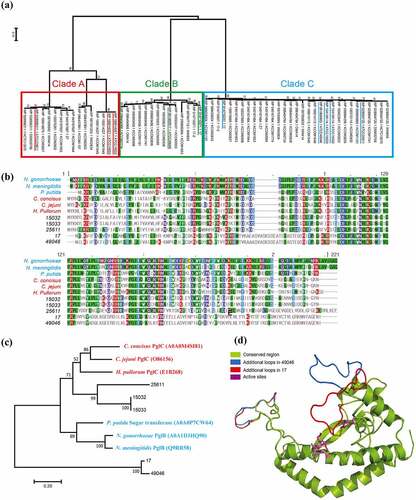
Figure 5. Carbohydrate utilization of P. intermedia strains. Bacterial growth in the presence of carbohydrates is expressed as a ratio relative to growth in the absence of carbohydrates (control). *, P <0.01, versus control. Mann-Whitney U test.
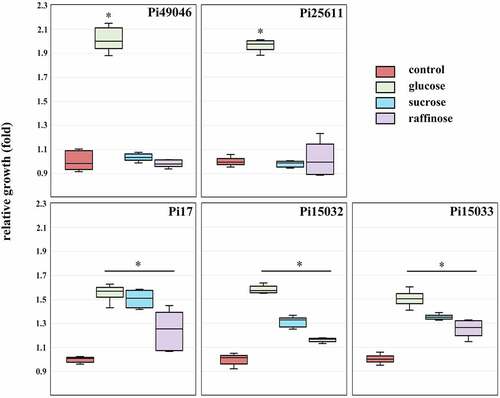
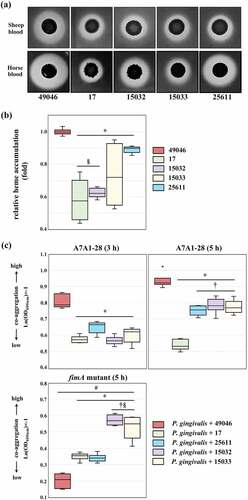
Figure 6. Phenotypic evaluation of nutrient acquisition. (a) Haemolytic activity. Images of beta-haemolysis zones produced after 7 days. (b) Haem accumulating activity. The haem-accumulating activity of each strain is expressed as a ratio relative to the haem-accumulating activity of Pi49046. (c) Co-aggregation activity with P. gingivalis A7A1–28 (carrying fimA type II) and fimA II-deficient mutant. Data are presented as the natural logarithm of OD600 × (‒1). *, P <0.01, versus Pi49046; †, P <0.01, versus Pi17; §, P <0.01, versus Pi25611; #, A7A1–28 (5 h) versus fimA II-deficient mutant. Mann-Whitney U test.
Supplemental Material
Download PDF (1.5 MB)Data availability statement
The authors confirm that the data supporting the findings of this study are available within the article and its supplementary materials.