
Figures & data
Figure 1. MDV and REV enhanced mutual replication and activated the Akt pathway in co-infected cells. (a) Co-infection model of REV and MDV and schematic of workflow for viral replication test, tandem mass tag peptide labelling coupled with LC-MS/MS analysis of CEF cells single-infected and co-infected with REV and MDV. (b) the kinetics of REV and MDV replication was tested in CEF cells. MDV-infected, REV-infected, and REV and MDV co-infected CEF cells or cell cultures were assessed for MDV pfu or REV TCID50 24, 48, 72, and 96 hpi. The data represent the means of three independent experiments, with each experiment performed in triplicate. (c) Western blotting analysis of the MDV-pp38 and REV-gp90 expression. β-actin was used as an internal control to normalize the quantitative data. (d) Immuno-fluorescence analysis of REV and MDV infection in CEF cells. CEF cells were infected with MDV (MOI = 0.1, 100PFU) or REV (MOI = 1,1000 TCID50) for 48 h, and then MDV-pp38 (red) and REV-gp90 (green) were observed under an immunofluorescence microscope. (e) KEGG enrichment analysis of signalling pathways between REV and MDV co-infected CEF cells compared with single-infected CEF cells. Akt signalling pathway was indicated by the arrows. (f) Heatmap highlighting differences in the enrichment of cellular proteins between REV and MDV co-infected CEF cells compared with single-infected CEF cells, as indicated by the arrows. N, mock-infected CEF cells; R, REV-infected CEF cells; M, MDV-infected CEF cells; RM, REV and MDV co-infected CEF cells. Data are presented as the mean ± SD from three independent experiments. (One-way ANOVA, *p <0.05,**p <0.01).
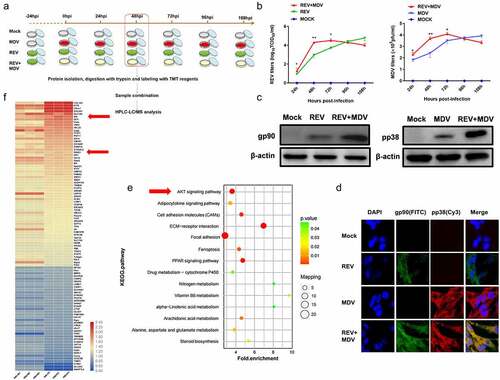
Figure 2. Synergistic replication of REV and MDV is dependent on Akt. (a) CEF cells were transfected with the empty vector or the Akt expression plasmid and shNC or shAkt. Twenty-four hours later, they were infected with MDV (MOI = 0.1,100PFU), REV (MOI = 1, 1000 TCID50), and REV and MDV. The REV and MDV viral titres were tested at 48 hpi (b, c). (d) Quantification of relative Akt band intensities to actin in (a). Data are presented as the mean ±SD from three independent experiments. Statistical analysis was performed using Student’s t-test (*, p <0.05; **, p <0.01).
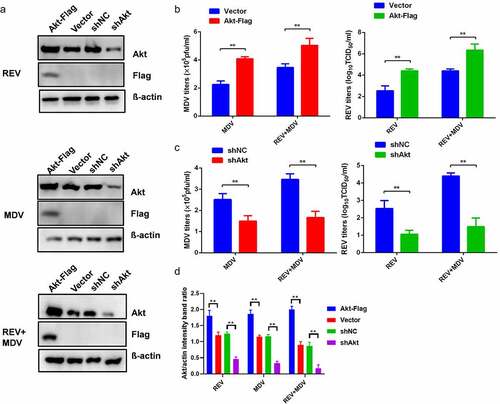
Figure 3. Characterization of REV and MDV co-induced Akt pathway activation. Different time points experiment in CEF cells co-infected or single-infected for 6 h (a) and 48 h (b) with REV and MDV in PBS or mock-infected. Cell lysates were prepared at the indicated time points and analysed by western blot analysis for Akt phosphorylation at Ser473, total Akt expression and 4EBP1 phosphorylation at Ser65, total 4EBP1 as well as MDV-pp38 and REV-gp90 expression; β-actin was used as a internal control. (c) Quantification of relative Akt band intensities to actin, relative pAkt band intensities to Akt and relative p4ebp1 band intensities to 4EBP1 in (a and b). Data are presented as the mean ±SD from three independent experiments. Statistical analysis was performed using Student’s t-test (*, p <0.05; **, p <0.01).
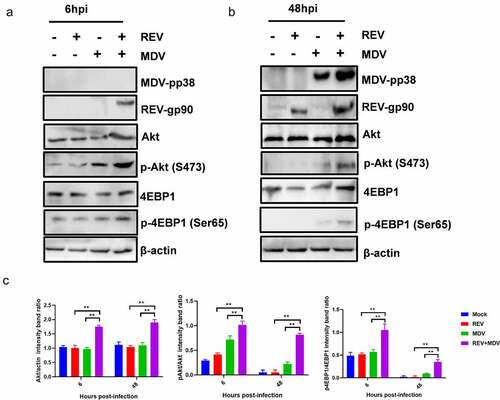
Figure 4. REV and MDV co-infection activates Akt phosphorylation in a PI3K-independent manner. (a and b) Akt inhibitor blocked MDV and/or REV-induced Akt phosphorylation. CEF cells were preincubated with MK2206 (25 nM) for 1 h, co-infected or single-infected with REV and MDV for 6 h, and cell lysates were analysed for the expression of pAkt (Ser 473), total Akt, and β-actin by western blotting. (c and d) Inhibition of PI3K does not influence viral replication of REV and MDV. CEF cells were co-infected or single-infected with REV and MDV (MOI = 1 for 1 h) and treated with 20 μM Ly294002 for another 6 h. (c) MDV plaque quantification. (d) TCID50 detection of REV titre. (e and f) Toxicity testing of Akt and PI3K-specific inhibitor. CEFs were treated with Akt inhibitor (5–35 nM), PI3K inhibitor (5–30 nM) and analysed for survival using the CCK-8 assay. (g) Quantification of relative pAkt band intensities to Akt and relative p4ebp1 band intensities to 4EBP1 in (a and b). The data represent the mean ± SD of three independent experiments. One-way ANOVA, (*, p <0.05; **, p <0.01).
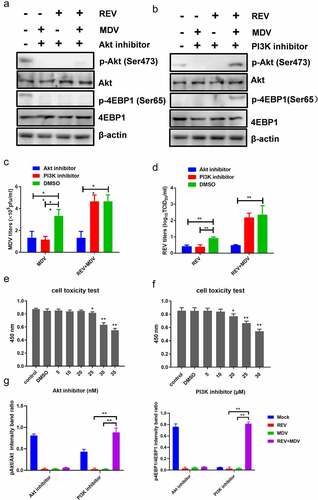
Figure 5. RIOK3 is required for synergistic replication of REV and MDV. (a) REV and MDV synergistically promote RIOK3 expression. The expression of RIOK3 during viral infection was assessed using western blotting. (b) RIOK3 knockdown decreased the level of Akt phosphorylation in REV and MDV co-infected cells. CEF cells were transfected with shRIOK3 and co-infected with REV and MDV for 6 h. Cell lysates were collected and analysed using western blotting with the indicated antibodies. (c and d) RIOK3 knockdown attenuates synergistic replication of REV and MDV. CEF cells were transfected with shRIOK3 and then co-infected with REV and MDV for 48 h. The MDV titre was measured using plaque quantification (c) and REV titre detected by TCID50 (d). (e and f) Quantification of relative RIOK3 band intensities to actin and relative pAkt band intensities to Akt (a and b). The data represent the mean ± SD of three independent experiments. One-way ANOVA, (*, p <0.05; **, p <0.01).
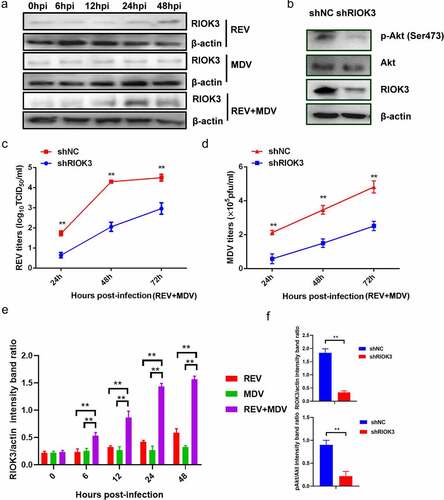
Figure 6. Akt phosphorylation is dependent on the RIOK3 expression level. (a and b) Increased expression level of RIOK3 increases Akt phosphorylation. DF-1 cells were transfected with the indicated amount of RIOK3 (a) or RIOK3 K290A (b). After 24 h, cell lysates were collected and analysed by western blotting with the indicated antibodies. (c) MDV plaque quantification. (d) TCID50 detection of REV titre. (e) Quantification of relative pAkt band intensities to Akt (a and b). All results are representative of three replicate experiments, and the data represent the mean ± SD. One-way ANOVA, (*, P <0.05; **, P <0.01).
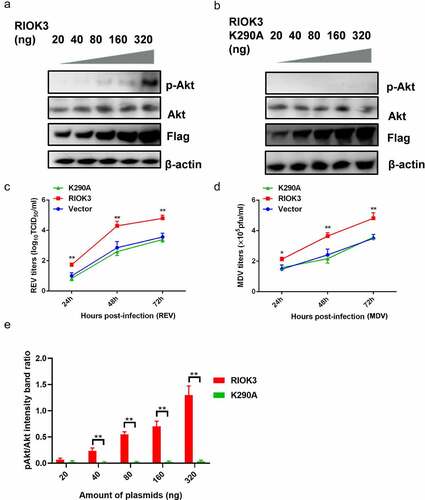
Figure 7. RIOK3 interacts with Akt. (a and b) Immunoprecipitation between RIOK3 and Akt. DF-1 cells were co-transfected with the RIOK3-Flag, RIOK3-K290A, and Akt-HA expression plasmids for 36 h, followed by a co-immunoprecipitation (co-IP) assay for RIOK3-Flag and Akt-HA using anti-HA (IP: HA) (a) or anti-Flag (Ip:flag) antibody (b). (c) Detection of co-localization of RIOK3 and Akt by IFA. DF-1 cells were transfected with the RIOK3-Flag or an empty vector, and 36 hpi, IFA was performed. The RIOK3 (green) and Akt (red) proteins were visualized with anti-Flag and anti-HA antibody. Cell nuclei (blue) were stained with DAPI. The areas of co-localization in merged images are shown in yellow.
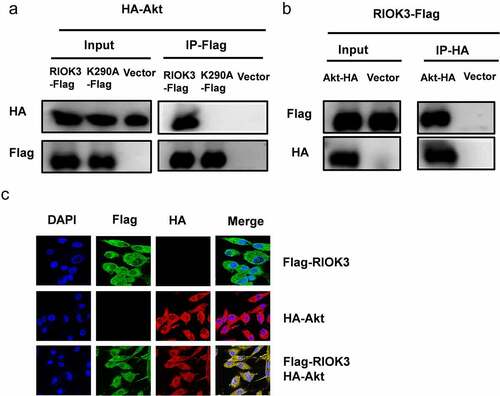
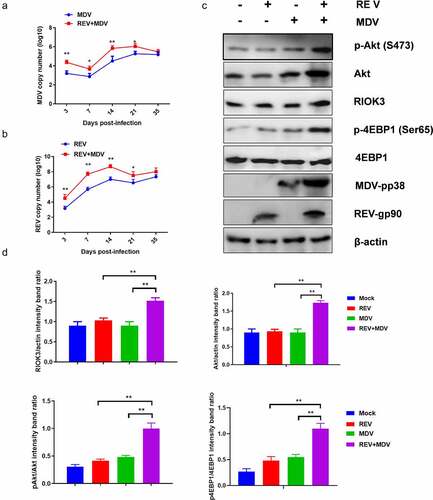
Figure 8. Co-Infection chicken model of REV and MDV for viral synergistic replication test. Replication kinetics of Md5 (a) or SNV (b) in REV and MDV coinfected chicken using qPCR. (c) Spleen of MDV/REV infected and co-infected chicken were collected at 14 dpiand analysed using western blotting with the indicated antibodies. (d) Quantification of relative RIOK3/Akt band intensities to actin, relative pAkt band intensities to Akt and relative p4ebp1 band intensities to 4EBP1 in (c. The data represent the mean ± SD of three independent experiments. One-way ANOVA, (*, p <0.05; **, p <0.01).
Supplemental Material
Download MS Excel (18.5 KB)Data availability statement
The authors confirm that the data supporting the findings of this study are available within the article and its supplementary materials.