
Figures & data
Table 1. Clinical samples and SARS-CoV-2 rRT-PCR assay in this study.
Figure 1. Phylogenetic analysis of severe acute respiratory syndrome coronavirus 2 strains. A maximum likelihood phylogenetic tree was generated with 27 sequences from this study (yellow, n = 26; green, n = 1) and 149 SARS-CoV-2 genomes obtained from GISAID. All of the SARS-CoV-2 genomes in South Korea were downloaded from the GISAID database, and 149 sequences that matched the proportion of sequences and date range of sample collection as the total dataset were obtained. Diamond and triangle at each branch tip represent samples from patient 1 and patient 2, respectively.
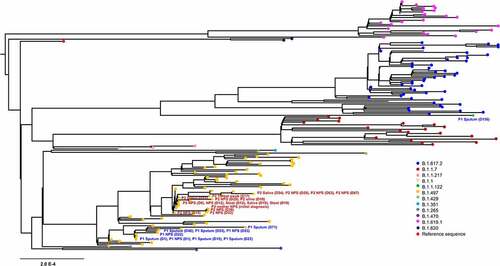
Figure 2. Heatmap representing SARS-CoV-2 variant allele frequency of each variant detected in the samples. Variants that were not detected because of low coverage are shown in black.
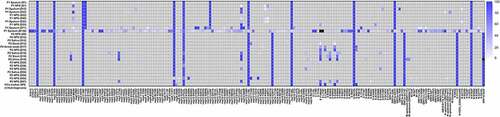
Figure 3. Pairwise genetic distance among serial SARS-CoV-2 respiratory samples during the course of infection. The L1 norm genetic distances are shown by a colour gradient and size difference. Sputum specimens (patient 1) and nasopharyngeal swabs (patient 2) for each time point were analysed.
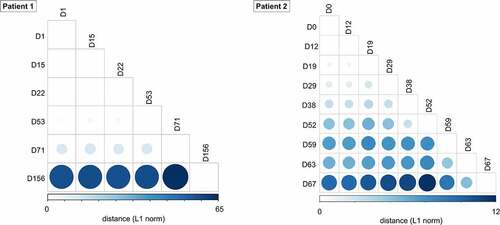
Figure 4. Temporal dynamics of SARS-CoV-2 variants within spike gene and corresponding viral loads during the patient’s course of infection in each patient (A and C, patient 1; B and D, patient 2). A lower cycle threshold (Ct) value corresponds to a higher viral load.
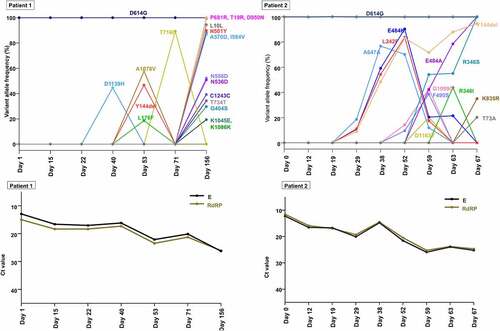
Figure 5. Genetic distance between sample pairs. (a) Sample pairs were classified into three subgroups: (1) intrahost sample pairs obtained at different time points, (2) intrahost sample pairs obtained from different anatomic sites. (b) the sample pairs were categorized into urine/non-urine sample pairs and non-urine/non-urine sample pairs. Box (median ± 25%) and whisker (5% and 95%) plots represent the distribution of the genetic distances (L1 norm) between sample pairs.
Supplemental Material
Download Zip (2.4 MB)Data availability statement
Data obtained in this study were submitted to the Sequence Read Archive (SRA) (https://doi.org/10.1080/21505594.2022.2101198) under accession PRJNA801401.