Figures & data
Figure 1. Genetic polymorphism between Metarhizium brunneum isolate, Mb7 and MbK. (a) Venn diagram comparing identified mutations in isolates MbK and Mb7 based on reference genome Metarhizium brunneum 4556 (Asm1342620v1), conducted by Venny 2.1 tool [Citation56]. (b) Representative snapshot from IVG software showing deletion in MbK genome compared with reference genome and Mb7 isolate. Location in reference genome CP058935.1 nt 101,270. gff: represents gene annotations, upstream to XP_014539572.1 (MEP1) and downstream to XP_014539573.1 (PR1C) (c) Enlargement of IGV snapshot of the deletion in MbK isolate compared with reference genome and Mb7 isolate.
![Figure 1. Genetic polymorphism between Metarhizium brunneum isolate, Mb7 and MbK. (a) Venn diagram comparing identified mutations in isolates MbK and Mb7 based on reference genome Metarhizium brunneum 4556 (Asm1342620v1), conducted by Venny 2.1 tool [Citation56]. (b) Representative snapshot from IVG software showing deletion in MbK genome compared with reference genome and Mb7 isolate. Location in reference genome CP058935.1 nt 101,270. gff: represents gene annotations, upstream to XP_014539572.1 (MEP1) and downstream to XP_014539573.1 (PR1C) (c) Enlargement of IGV snapshot of the deletion in MbK isolate compared with reference genome and Mb7 isolate.](/cms/asset/8638c234-544a-45c9-971a-a268e77655f9/kvir_a_2101210_f0001_oc.jpg)
Table 1. SNPs and INDELs located near predicted genes distinguishing between M. brunneum isolates MbK and Mb7.
Figure 2. de novoanalysis of Mb7 and MbK genomes (a) Venn diagram representing the comparison of orthogroups found in Mb7, MbK and the reference genome Metarhizium brunneum 4556 (Asm1342620v1), conducted by Venny 2.1 tool [Citation56]. Orthologous proteins were identified with OrthoFinder. (b) Gene tree (using OrthoFinder program) of representative orthogroup (OG0000096; annotation - Alkaline proteinase) for differential gene count between MbK, Mb7 and the reference genome; Scaled by branch length.
![Figure 2. de novoanalysis of Mb7 and MbK genomes (a) Venn diagram representing the comparison of orthogroups found in Mb7, MbK and the reference genome Metarhizium brunneum 4556 (Asm1342620v1), conducted by Venny 2.1 tool [Citation56]. Orthologous proteins were identified with OrthoFinder. (b) Gene tree (using OrthoFinder program) of representative orthogroup (OG0000096; annotation - Alkaline proteinase) for differential gene count between MbK, Mb7 and the reference genome; Scaled by branch length.](/cms/asset/dd905808-bcfe-4ca8-b108-a2c7b72ebefd/kvir_a_2101210_f0002_oc.jpg)
Figure 3. Validation of adenine methylation in the swc4 gene. (a) Schematic representation of the entire swc4 gene (nt 1–1971). Numbers above the scheme represent locations of GATC sites in the sequence. Arrows represent primers by orientation and location within the sequence. (b) Agarose (1%) gel demonstrating amplification using SWC4_1 and SWC4_2 primers, giving an amplicon of 324 bp. (c) Agarose (1%) gel demonstrating amplification using SWC4_3 and SWC4_4 primers, giving an amplicon of 1248 bp. Samples: M − 1 kb DNA ladder; 1 – undigested Mb7 gDNA; 2 – undigested MbK gDNA; 3 – DpnI-digested Mb7 gDNA; 4 – DpnI-digested MbK gDNA. (d) Differential expression of swc4 between M. brunneum isolates Mb7 and MbK tested by qRT-PCR using translation elongation factor 1 alpha (tef) as a reference. Asterisk represents statistical significance by t-test analysis (p <0.05).
Figure 4. Schematic representation of the mutants generated in this study. (a) swr1 complex protein 4 (swc4) with integration of hph-gfp starting from nt position 132 of swc4, hph stop codon deleted, and swc4 remaining in-frame until the native stop codon at nt position 1972 of the gene. (b) swr1 gene with integration of hph-gfp starting from nt position 1978, hph stop codon present at its original location and before nt position 1979 of swr1. Top yellow-shaded boxes in both panels represent PCR sequence alignments.
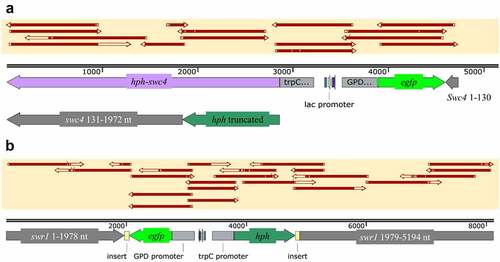
Figure 5. Characterization of fungal morphology and growth. (a) Conidial concentration (1 x 10⁶ conidia/ml ± SE) of the fungal isolates, in a 5-mm agar piece/5 mL Triton X-100 as counted by haemocytometer. (b) Conidia visualized in haemocytometer (enlarged photo of light microscopy, × 400 magnification). (c) Germination rate (% ± SE) of 1 × 10⁷ conidia/ml 16 h after spreading on an SDA plate. (d) Germinated conidia, 16 h after spreading of 1 × 10⁷ conidia/ml on an SDA plate (visualized using light microscopy at × 400 magnification, bar size: 50 µm). (e) Radial growth (cm ± SE) after placing 1 × 10⁶ conidia/ml on the centre of an SDA plate. (f) Radial growth on SDA plates (60 mm) at 7 d (top images) and 14 d (bottom images). Statistical analysis was carried out by Tukey – Kramer test, significant differences are marked with different letters (p <0.05).
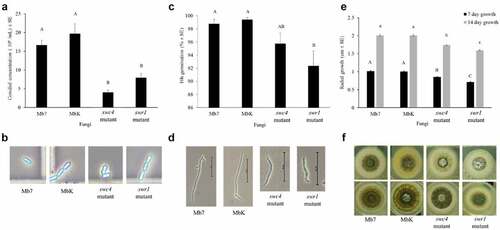
Figure 6. Cumulative mortality (% ± SE) of G. mellonella inoculated with spore suspensions of M. brunneum isolates MbK, Mb7 and mutants of the genes swr1 and swc4 for 7 d postinoculation. Statistical analysis were carried out on arcsine square root-transformed values of mortality proportion using Tukey – Kramer test; significant differences are indicated with different letters (p <0.05). On the right: representative larvae infected with (from top to bottom): MbK, Mb7, MbK-swc4-mutant, MbK-swr1-mutant and non-infected larvae.
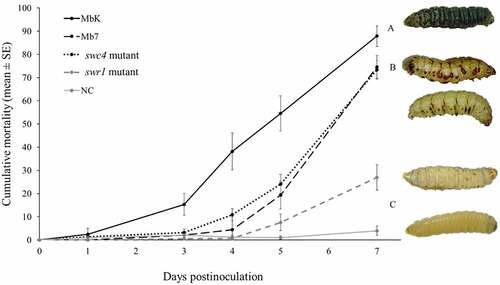
Figure 7. Metabolomic comparison between Mb7, MbK and MbK-swc4-mutant cultured in Sabouraud dextrose broth (SDB). (A) Total ion chromatograms of the culture filtrates from Mb7 (top), MbK-swc4-mutant (middle) and MbK (bottom). Data were recorded in positive ionization mode. (B) PCA score plot of the LC – MS data acquired in positive mode. Mb7 replicates are depicted in blue; MbK replicates in brown; and MbK-swc4-mutant replicates in red. (C) Hierarchal condition tree heatmap of differential metabolic profiles from M. brunneum culture filtrates. The abundance of each compound is associated with a colour ranging from blue (less abundant) to red (more abundant).
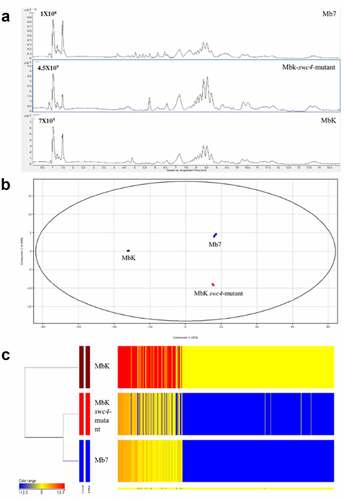
Table 2. Identified metabolites of Metarhizium spp. obtained by LC – MS analysis.
Table 3. Significant differences in metabolites between filtrates from Mb7, MbK, and MbK-swc4-mutant (swc4) cultured in SDB.
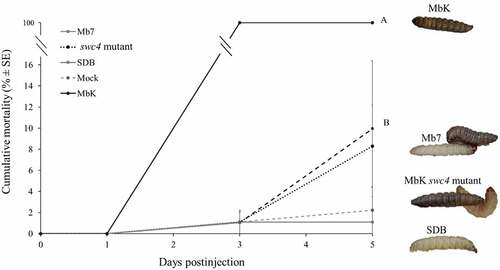
Figure 8. Cumulative mortality (% ± SE) of G. mellonella inoculated with filtrate collected from M. brunneum isolates MbK, Mb7 and MbK-swc4-mutant during 5 d postinjection. Statistical analysis was carried out on arcsine square root-transformed values of mortality proportion using Tukey – Kramer test, and significant differences are indicated by different letters (p <0.05). On the right: representative larvae injected with (from top to bottom) MbK, Mb7 and Mbk-swc4-mutant filtrate. SDB, Sabouraud dextrose broth.