
Figures & data
Figure 1. Distribution of putative RBPs in the genome of S. suis strain ZY05719. The nine putative RBPs screened from the NCBI database were shown in the circular diagram. The blue circles (outermost circles) represent the CDS (coding sequence) on the negative or positive chains. The purple and green circles (middle circles) represent the negative and positive GC skew, respectively. The black circles (innermost circles) represent the GC content. Map was drawn by the CGView ServerBETA (http://cgview.Ca/).
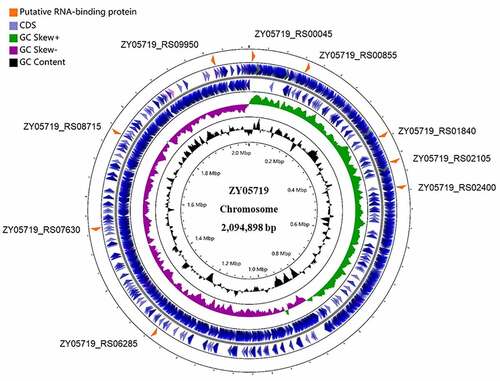
Figure 2. Structural prediction and phylogenetic tree of RbpA. (a) Predicted three-dimensional structure of RbpA by the SWISS-MODEL online server. The two small α-helices and five-stranded antiparallel β-sheet are indicated at the corresponding positions. (b) the secondary structural elements are shown in the RbpA sequences by arrows. (c) Phylogenetic analysis of RbpA from Streptococcus species and several reported RBPs from other bacterial species. The tree was constructed with MEGA7 software using the neighbor-joining method. Corresponding serotypes and strain names are shown after the accession numbers of the proteins. All amino acid sequences used in this analysis were downloaded from the NCBI database.
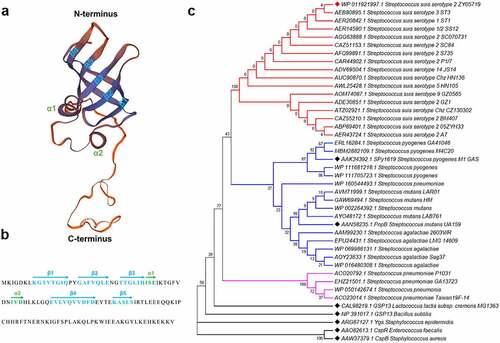
Figure 3. RbpA facilitates SS2 adhesion to HEp-2 cells. (a) the rbpA deletion affects the SS2 adhesion to HEp-2 cells. The adherent bacterial numbers were evaluated by determining the number of CFU in each well. The statistical significance was calculated by two-tailed unpaired Student’s t tests (*, P < 0.05; **, P < 0.01). (b) Fluorescence microcopy of SS2 adhesion to HEp-2 cells. The WT and ΔrbpA strains were transformed with the pKSM411 plasmid and detected directly with FITC (in green), while the nucleoids of HEp-2 cells were stained with DAPI (in blue). The WT strain without the pKSM411 plasmid was set as the control group.
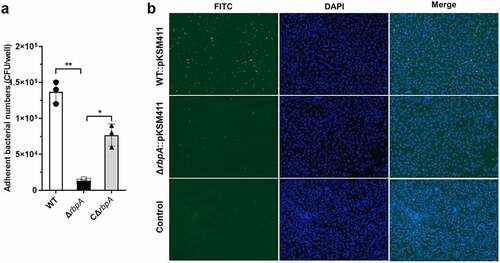
Figure 4. RbpA contributed to the pathogenicity of SS2. (a) Survival curves of mice infected with the WT, ΔrbpA, and CΔrbpA strains. (b) Histopathology of infected tissues from mice at 3 days postinfection with the WT, ΔrbpA, and CΔrbpA strains. The infected tissues were stained by hematoxylin and eosin and examined using light microscopy. Hollow arrows show hemorrhage and yellow arrows show inflammatory cell infiltration. (c) Score for histopathologic changes of infected tissues from mice at 3 days postinfection with the WT, ΔrbpA, and CΔrbpA strains. Histopathologic sections were randomly selected from each infected tissue and scored based on severity and inflammation. The statistical significance was calculated by two-tailed unpaired Student’s t tests (***, P < 0.001).
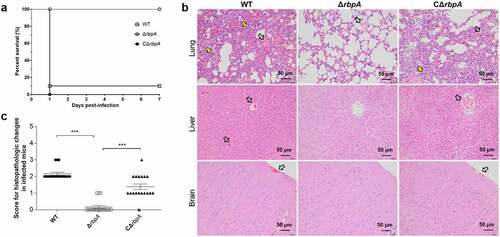
Figure 5. Comparative proteomic analysis of the differentially expressed proteins between WT and ΔrbpA strains. (a) Volcano plot of differentially expressed proteins between WT strain and ΔrbpA strain determined based on the proteomic data. The ratio of the protein expression level between the WT strain and ΔrbpA strain was standardized with a P-value < 0.05 and a ratio ≥ 1.2 to define the differentially expressed proteins. (b,c) Western blotting analysis of the proteomics data. ZY05719_RS01400, GlnQ, LysM,’ and IgA1 were chosen to verify the protein expression levels, and GroEL was used as a control protein. Equal amounts of the whole bacterial proteins from the WT and ΔrbpA strains containing the SPA-tag sequence were subjected to SDS-PAGE and then immunoblotting with an anti-FLAG antibody. The grayscale of the reactive protein bands was measured by using a software program. Fold change = grayscale of target protein in ΔrbpA/grayscale of target protein in WT. (d) GO analysis of the RbpA-regulated proteins. These proteins are grouped into three terms: biological process, cellular component, and molecular function. (e) KEGG pathway enrichment of the RbpA-regulated proteins. The x-axis represents the enriched pathways, and the y-axis represents the proteins number of the differentially expressed proteins involved in each pathway.
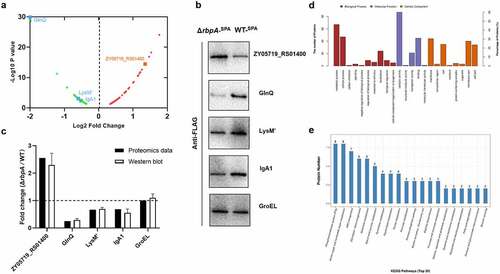
Figure 6. RbpA regulates the expression of virulence-associated factors. (a) Transcriptional analysis of the virulence-associated factors. qRT-PCR expression values are presented as the means plus standard deviations from three independent experiments. (b, c) β-Galactosidase activity (Miller Units) detected for different gene fusions in the WT, ΔrbpA, and CΔrbpA strains. The results represent the means of three independent experiments. The statistical significance was calculated by two-tailed unpaired Student’s t tests (ns, P > 0.05; *, P < 0.05; **, P < 0.01).
Supplemental Material
Download Zip (2.1 MB)Data availability statement
All data generated or analysed during this study are included in this article and its supplementary information files. The proteomics raw data of this study have been deposited under the accession number IPX0003548002 at iProX.