
Figures & data
Figure 1. Maximum likelihood phylogenetic tree analyses of the near full-length genome sequences (790–8795 in the HXB2 genome) of 11 HIV-1 recombinants included in this study, derived from a cohort of consenting, newly diagnosed or chronic, antiretroviral naïve HIV-1-infected patients from Cyprus. The phylogenetic analyses were conducted against a reference dataset of all known HIV-1 subtypes and CRFs using the RIP Alignment 2020 downloaded from the Los Alamos HIV Sequence Database (http://www.hiv.lanl.gov). The HIV-1 clades are colour coded on the periphery of the maximum likelihood tree based on the HIV-1 genotypic subtypes, and the colour coding is defined below the tree. Each reference sequence is named to display the HIV-1 genotypic subtype, followed by the GenBank accession number, as indicated in grey. The sequences of the samples from Cyprus are indicated in black using their unique laboratory identification number, in which the prefix CY is followed by a number denoting the laboratory code. The branches highlighted in red represent the HIV-1 recombinant transmission cluster, consisting of the samples CY494, CY520, CY533, CY614, CY622, CY630, CY640, CY670, CY686, and CY742, characterized as CRF91_cpx. The sample CY467, which was characterized as the URF of CRF91_cpx, “Rec. of 91_cpx, B,” also appears within the HIV-1 recombinant transmission cluster highlighted in red. The phylogenetic clustering of the CRF91_cpx transmission cluster was considered to be definitive based on a genetic distance of 0.045 as the threshold and a 70% bootstrap support value.
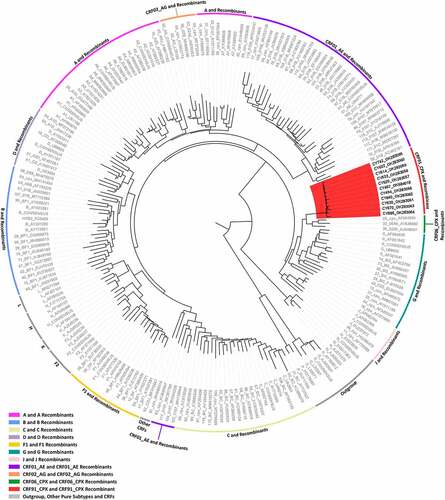
Figure 2. Recombination analyses of the near-full-length HIV-1 genome sequence (790–8795 in the HXB2 genome) of sample CY533 used as a representative sample to illustrate the intersubtype mosaic structure of the CRF91_cpx strain. The recombination analyses were conducted against a reference dataset of HIV-1 group M subtypes (A, B, C, D, F, G, H, J and K) and CRF02_AG downloaded from the Los Alamos HIV Sequence Database (http://www.hiv.lanl.gov) as well as the top two CRF02_AG BLAST hits. (A) The upper left diagram in this scheme illustrates the genomic map of sample CY533, which was generated by the Recombinant HIV-1 Drawing Tool (https://www.hiv.lanl.gov/content/sequence/DRAW_CRF/recom_mapper.html). The numbers above the diagram indicate the intersubtype recombination breakpoints in accordance with the HXB2 numbering. The near full-length HIV-1 genome was divided into seven fragments based on the six recombination breakpoints, showing its unique mosaic structure. The subtype origin of each fragment is colour coded in accord with informative analyses, and the colour coding is defined in the middle of the scheme. The middle left diagram displays the similarity plot analysis, in which the y-axis represents the percent similarity of the query sequence to the reference dataset. The bottom left diagram displays the bootscan analysis, where the y-axis represents the bootstrap support value. The x-axes of both diagrams represent the nucleotide positions in accordance with HXB2 numbering. The dotted horizontal line specifies the 70% bootstrap support value, which was considered to be definitive for subtype origin. The colour coding used for the similarity plot and bootscan analyses is identical to the colour coding of the genomic map. The similarity plot and bootscan analyses were performed in SimPlot v3.5.1 software. The parameters included a sliding window of 400 nucleotides, overlapped by 40 nucleotides, with 1,000 bootstrap replicates. (B) The right diagram illustrates the subregion confirmatory neighbour-joining tree analyses performed with MEGA X software. The neighbour-joining trees were constructed for each of the seven fragments characterized by the similarity plot and bootscan analyses. The phylogenetic analyses employed the Kimura two-parameter nucleotide substitution model with 1,000 bootstrap replicates to assess the reliability of the phylogenetic clustering results. A bootstrap support value of 70% was considered definitive for subtype origin. The region of the nucleotide sequences encoding each of the seven fragments is denoted above each tree with respect to HXB2 numbering. The dotted line ending with a black dot represents the query sequence of each tree. The colour coding used for the neighbour-joining trees is identical to the colour coding of the genomic map, similarity plot and bootscan analyses.
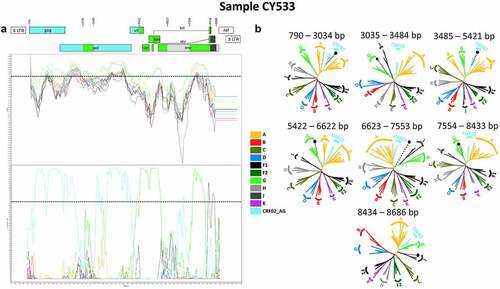
Figure 3. Recombination analyses of the near-full-length HIV-1 genome sequence (790–8795 in the HXB2 genome) of sample CY467 used to illustrate the intersubtype mosaic structure of the URF of the CRF91_cpx strain, “Rec. of 91_cpx, B.” The recombination analyses were conducted against a reference dataset of HIV-1 group M subtypes (A, B, C, D, F, G, H, J and K) and CRF02_AG downloaded from the Los Alamos HIV Sequence Database (http://www.hiv.lanl.gov) as well as the top two CRF02_AG BLAST hits. (A) The upper left diagram in this scheme illustrates the genomic map of sample CY467, which was generated by the Recombinant HIV-1 Drawing Tool (https://www.hiv.lanl.gov/content/sequence/DRAW_CRF/recom_mapper.html). The numbers above the diagram indicate the intersubtype recombination breakpoints in accordance with HXB2 numbering. The near full-length HIV-1 genome was divided into nine fragments based on the eight recombination breakpoints presenting its unique mosaic structure. The subtype origin of each fragment is colour coded in accord with informative analyses, and the colour coding is defined in the middle of the scheme. The middle left diagram displays the similarity plot analysis, where the y-axis represents the percent similarity of the query sequence to the reference dataset. The bottom left diagram displays the bootscan analysis, where the y-axis represents the bootstrap support value. The x-axes of both diagrams represent the nucleotide positions in accordance with HXB2 numbering. The dotted horizontal line specifies the 70% bootstrap support value, which was considered to be definitive for subtype origin. The colour coding used for the similarity plot and bootscan analyses is identical to the colour coding of the genomic map. The similarity plot and bootscan analyses were performed with SimPlot v3.5.1 software. The parameters included a sliding window of 400 nucleotides, overlapped by 40 nucleotides, with 1,000 bootstrap replicates. (B) The right diagram illustrates the subregion confirmatory neighbour-joining tree analyses performed with MEGA X software. The neighbour-joining trees were constructed for each of the nine fragments characterized by the similarity plot and bootscan analyses. The phylogenetic analyses employed the Kimura two-parameter nucleotide substitution model with 1,000 bootstrap replicates to assess the reliability of the phylogenetic clustering results. A bootstrap support value of 70% was considered to be definitive for subtype origin. The region of the nucleotide sequences encoding each of the nine fragments is denoted above each tree with respect to HXB2 numbering. The dotted line ending with a black dot represents the query sequence of each tree. The colour coding used for the neighbour-joining trees is identical to the colour coding of the genomic map, similarity plot and bootscan analyses.
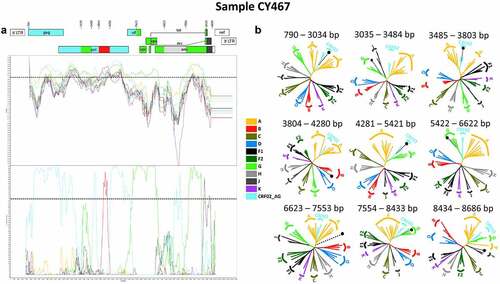
Table A1. Clinical, epidemiological and behavioural information of the 11 HIV-1-infected patients included in this study.
Supplemental Material
Download MS Word (9 MB)Data availability statement
The DNA nucleotide sequence data that support the findings of this study are openly available in GenBank at https://www.ncbi.nlm.nih.gov/genbank/