
Figures & data
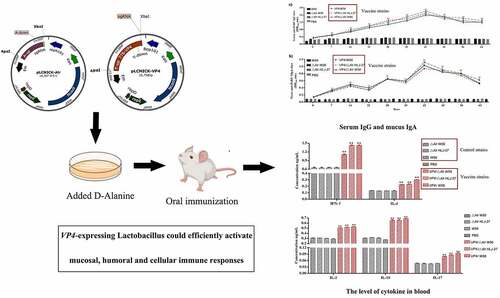
Figure 1. Schematic drawing of the construction of gene editing pLCNICK series plasmids (a,b) and the plasmids-mediated Alr knockout and VP4 expression cassette insertion (replacement) in Lactobacillus chromosome (c,d). The black boxes shown in the figure are the replacement parts in different plasmids. a: the plasmid pLCNICK-Alr construction process. The PCR products of upstream (Alr-up) and downstream homologous arms (Alr-down) were acquired from the genome of Lactobacillus W56 stored in our laboratory. The sgRNA sequence was designed by predecessors targeting the Alr site, synthesized by Kumei Biotechnology Co., Ltd (Jilin, China). The fragments were fused into a sequence with the repetitive sequence in the primers and inserted into the vector pLCNICK at Apa I and Xba I restriction sites, generating the gene editing plasmid pLCNICK-Alr. b: the plasmid pLCNICK-VP4 construction process. The genes coding the promoter P776 and the fragments RBS-VP4 were amplified with the plasmids pPG-P776-EGFP and pMD19T-RBS-VP4, respectively, constructed in the laboratory. The upstream (thyA-up) and downstream homology arms (thyA-down) and sgRNA sequence are obtained as described earlier, yet the targeted site was thyA. The fragments were amplified by fusion PCR in the order thyA-up, P776, RBS-VP4, thyA-down, and sgRNA with the complementary sequence in the primers and inserted into the vector pLCNICK at Apa I and Xba I restriction sites, yielding the gene editing plasmid pLCNICK-VP4.
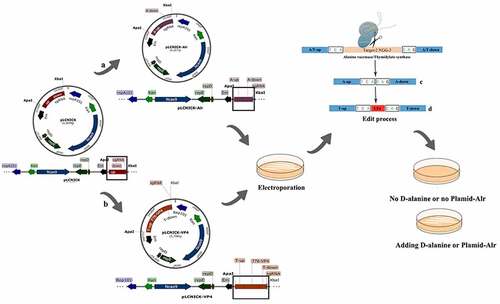
Table 1. The sequence of primers.
Table 2. The sequence of VP4.
Figure 2. Immunization procedures of mice and the process of samples collection. Mice were immunized once a day for 3 consecutive days (days 0, 1, and 2) and boosted twice at 2-week intervals (days 14, 15, and 16 and days 28, 29, and 30). Feces, sera, vaginal fluid, and intestinal mucus were collected (black check marks) at different time points. The red circle means the time point to detect the level of cytokines and CD4/CD8 T-cell and lymphocyte proliferation. Sampling time points were calculated post the primary immunization.
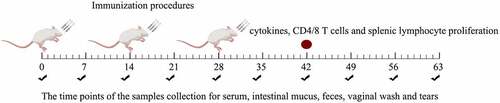
Figure 3. Identification and analysis of the stability Lactobacillus strains △Alr HLJ-27 and VP4/△Alr W56, VP4/△Alr HLJ-27 and VP4/W56. a: PCR amplification fragments of 1500 bp and 2700 bp correspond to the deletion mutant and wild type. b–d: PCR amplification fragments of 1893 bp and 2583 bp correspond to the insertion mutant and wild type. The stability was detected for every two generations using the primers Alr-F/R (a) and the A-F/R to identify PCR products of mutant strains genome DNA. f–i: Western blot analysis the protein stability of insertion mutant strain VP4/△Alr W56, VP4/△Alr HLJ-27 and VP4/W56. Expression of VP4 protein by the strains were detected with anti-flag tag monoclonal antibody every four generations for VP4/W56, VP4/△Alr W56 and VP4/△Alr HLJ-27, respectively (j).
Figure 4. D-Alanine demand experiment of the mutant strains: “+” represents the MRS additional D-Alanine; “-” represent the basic MRS plates.
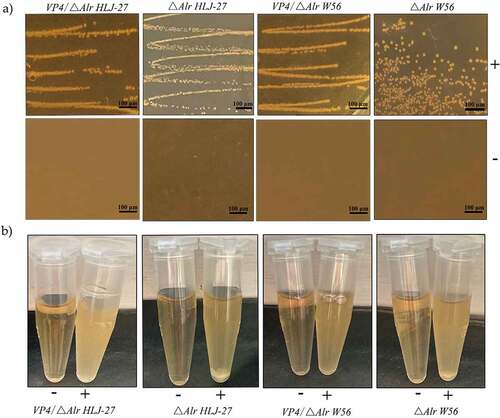
Figure 5. Anti-PoRV-Specific IgG antibody levels in the sera (a) and mucosal SIgA antibody in genital tract, intestinal mucus, and feces (b) by ELISA using PoRV as the coating antigen. Bars represent the mean SE in each group (**P < 0.01 compared to the control groups: △Alr HLJ-27, △Alr W56, W56 and PBS; Vaccine group strains: VP4/△Alr HLJ-27, VP4/△Alr W56 and VP4/W56).
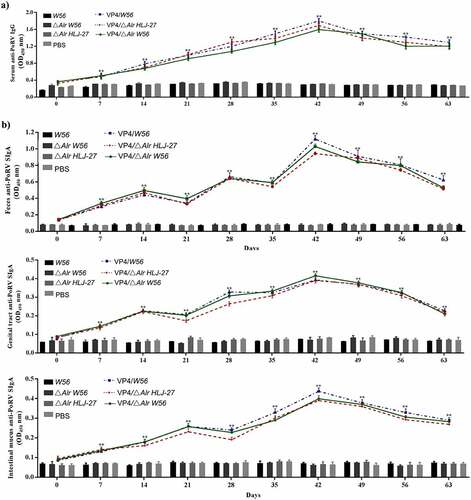
Figure 6. Levels of the anti-PoRV-specific neutralizing antibody titer in mice postimmunization serum. The results were determined by measuring the anti-PEDV IgG antibody and the anti-PEDV-neutralizing antibody titer with serial dilution in sera from immunized mice, ** P < 0.01 compared to the control groups.
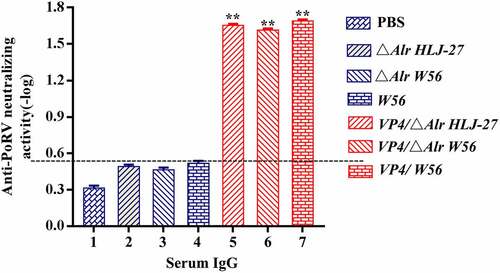
Figure 7. Determination of the level of lymphocyte proliferation (a) and specific T cell, CD8+% (b) and CD4+% (c) in splenic lymphocytes in immunized mice. The lymphocyte proliferation in immunized mice responding to PoRV VP4 antigen restimulation was determined by an MTT assay with ConA as a positive control. **P < 0.01 compared to the control groups: △Alr HLJ-27, △Alr W56, W56 and PBS.
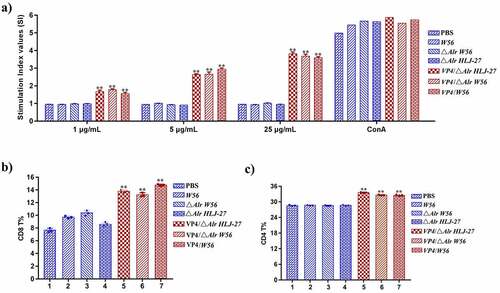
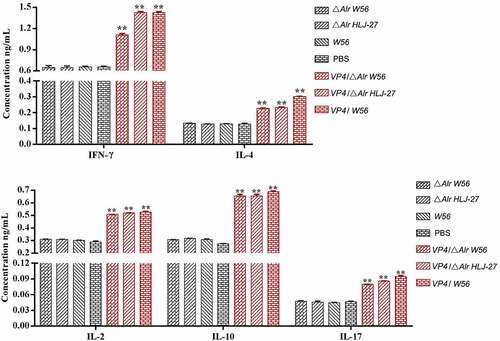
Figure 8. Determination the level of cytokine in blood in immunized mice with recombinant strains and PBS. The results are represented as the mean ± SEM of three independent experiments. * P < 0.05, **P < 0.01 compared to the control groups: △alr HLJ-27, △alr W56, W56 and PBS.
Data availability statement
The data that support the findings of this study are available from the corresponding author, Yijing Li, upon reasonable request.