
Figures & data
Figure 1. Adherence and invasion of UPEC-46 in different eukaryotic cell lines. (a) Quantitative adherence and (b) invasion assays for UPEC-46 were performed in a 3-h incubation period at 37 °C, without D-mannose, using HeLa, HT-29, or 5637 cells. Experiments were performed in biological triplicates and experimental duplicates. The ANOVA followed by Tukey’s multiple-comparison test was used for the statistical analyses. P-value:* P < 0.05; ***P < 0.001.
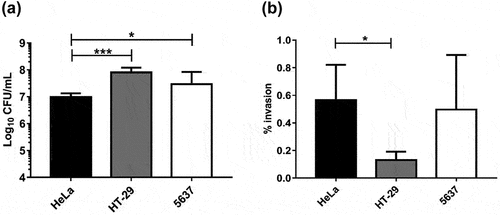
Figure 2. Colonization of bladders and kidneys mediated by UPEC-46 in a mouse model of ascending UTI. Groups of nine SPF-C57BL/6 mice were transurethrally inoculated with 1.0 x 10⁹ CFU of UPEC-46 strain and infections followed for 6, 12, 24, or 72 h. Animals were sacrificed and the (a) bladders (n = 8) and (b) kidneys (n = 16) from eight animals were collected for bacterial counts.
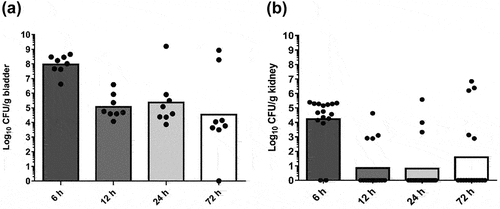
Table 1. Insertion sites of EZ-Tn5 <R6Kγori/KAN-2> transposon in UPEC-46 mutants displaying altered adherence on HeLa cells.
Figure 3. D-Mannose inhibition of adherence of UPEC-46 on different eukaryotic epithelial cell lines. UPEC-46 was submitted to quantitative adherence assays (incubation period of 3 h at 37°C) using HeLa, HT-29, or 5637 cell lines. Adherence of UPEC-46 to different cells was quantified in the absence or presence of 1% D-mannose. The experiments were performed in biological triplicates and experimental duplicates. The Student’s t- test was used for the statistical analyses. P-value: **P < 0.01; ****P < 0.0001.
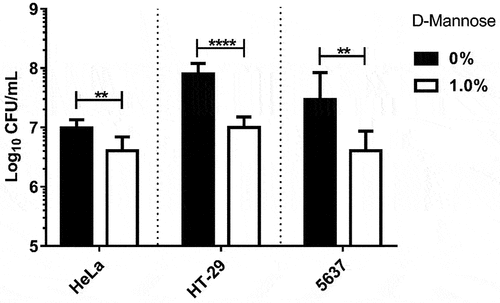
Figure 4. Role of AFP and TIF in the adherence of UPEC-46 on different eukaryotic epithelial cell lines. Quantitative adherence assays for UPEC-46, UPEC-46:afpA, and UPEC-46:afpA:fimH were performed in a 3-h incubation period at 37°C, without D-mannose, using (a) HeLa, (b) HT-29, or (c) 5637 cell lines. Experiments were performed in biological triplicates and experimental duplicates. The ANOVA followed by Tukey’s multiple-comparison test was used for the statistical analyses. P-value:*P < 0.05; ***P < 0.001; ****P < 0.0001.
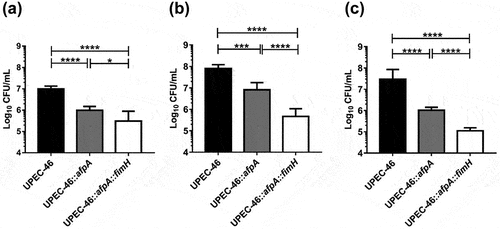
Figure 5. Role of AFP and TIF in the intestinal colonization in streptomycin-treated mouse model. Groups of eight SPF-BALB/c mice were orogastrically inoculated with 1.0 x 10³ CFU of UPEC-46 and derivative strains. Fresh fecal samples were collected once a day from each mouse for up to 14 days post-inoculation for (a) bacterial counts and obtaining the (b) area under the curve (cumulative bacterial counts) expressed in CFU/g of fecal. (c) SEM and TEM of colon fragments collected from mice infected with UPEC-46 and derivative strains on day 14. Non-infected colon fragment was used as a negative control. Bars, 2 µm. The Student’s t-test was used for the statistical analyses, comparing UPEC-46 and derivative strains. P-value: ****P < 0.0001.
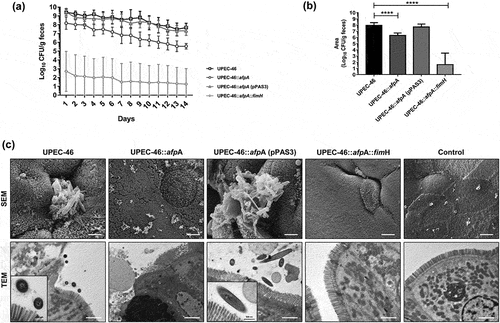
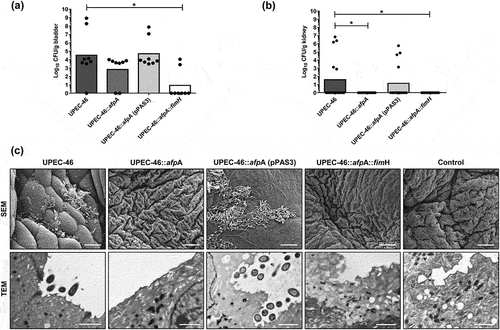
Figure 6. Role of AFP and TIF in the colonization of bladders and kidneys in a mouse model of ascending UTI. Groups of nine SPF-C57BL/6 mice were transurethrally inoculated with 1.0 x 10⁹ CFU of UPEC-46 and derivative strains. Three days after inoculation, mice were sacrificed and the (a) bladders (n = 8) and (b) kidneys (n = 16) from eight animals were collected for bacterial counts. (c) SEM and TEM of bladder fragments obtained from mice infected with UPEC-46 and derivative strains, 72 h post-inoculation. Non-infected bladder fragments were used as negative controls. Bars: SEM, 10 µm and TEM, 2 µm. The Student’s t- test was used for the statistical analysis, comparing UPEC-46 and derivative strains. P-value:*P < 0.05.
Supplemental Material
Download PDF (499.7 KB)Data availability statement
The authors confirm that the data supporting the findings of this study are available within the article and its supplementary materials. The raw data used in our analyses are available in the Butantan Institute Repository [https://repositorio.butantan.gov.br/handle/butantan/4315].