
Figures & data
Figure 1. Schematic of the RT-RAA-LFD assay developed for rapid visual detection of PDCoV nucleic acids. (a) Schematic diagram of the working principle of the nfo probe-based RT-RAA assay for PDCoV nucleic acid amplification. ATP-dependent recombinase binds each single-stranded oligonucleotide to form recombinase-primer/probe complexes that scan the duplex RNA template and recognize their respective homologous sequences. Upon homology detection, the primers and nfo probe hybridize to the target sequence through strand exchange and initiate DNA synthesis from the 3ʹ end under the action of DNA polymerase. The competitive binding regions in the primers and nfo probe within the displaced template strand are embedded by single-stranded DNA-binding (SSB) proteins to impede re-hybridization to the complementary chain. When the nfo probe hybridizes with the complementary strand, nfo nuclease recognizes and cuts the tetrahydrofuran (THF) residue in the probe and causes the blocking phosphate group behind THF to dissociate. Thence, a fresh 3ʹ-hydroxyl group is generated and it serves as a priming site for DNA polymerase extension. The cleaved probe and the reverse primer eventually form double-stranded amplicons integrating the antigenic labels biotin and FAM (6-carboxyfluorescein) at both 5’ termini, respectively. (b) Schematic of the sandwich-type lateral flow dipstick for detection of the PDCoV-specific amplicons produced by the nfo probe-based RT-RAA assay. The PDCoV-positive amplicons bearing the FAM and biotin antigenic labels flow through the conjugate pad pre-coated with colloidal gold-labelled streptavidin. The FAM-biotin-integrated amplicons bind the colloidal gold-labelled streptavidin and form a complex. The complex flows through the NC membrane and the anti-FAM monoclonal antibody fixed on the test line captures the complex via specific reactions with it. In this manner, a sandwich structure forms and it exhibits a characteristic red band indicating a positive result. The colloidal gold-labelled streptavidin and any excess free complex (if formed) flow forward and are captured by the bovine serum albumin (BSA)-biotin conjugate immobilized on the control line via specific reactions between the biotin and the colloidal gold-labelled streptavidin. In this way, a second red band is generated and the test results are validated. The appearance of red bands at both the test and control lines indicates positive detection. In contrast, the appearance of a single red band at the control line suggests a negative result.
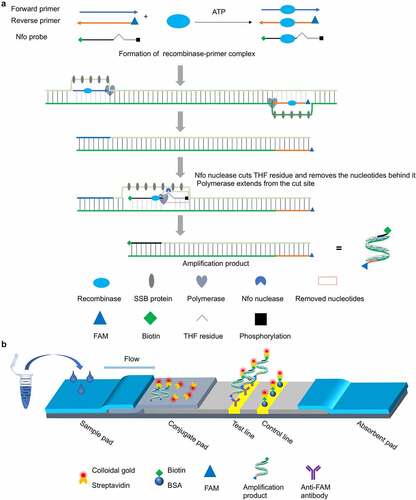
Table 1. Primers and probes used in this study.
Table 2. Comparison of the detection performance of the RT-RAA-LFD and trRT-PCR assays for PDCoV detection on 149 clinical swine samples.
Figure 2. Design and screening of the optimal primer-probe combinations for the RT-RAA-LFD assay. (a) Schematic diagram of the relative positions of the candidate primers and nfo probe in the selected detection target (16,000‒16,213 bp) within the ORF1b of PDCoV. (b) Representative amplification results of agarose gel electrophoresis-based RT-RAA assays using the randomly selected forward primer F1 to screen all seven reverse candidate primers (R1–R7). (c) Representative amplification results of agarose gel electrophoresis-based RT-RAA assays using R7 to screen all seven forward candidate primers (F1–F7). NTC, no-template control; M, Trans2K Plus II DNA Marker.
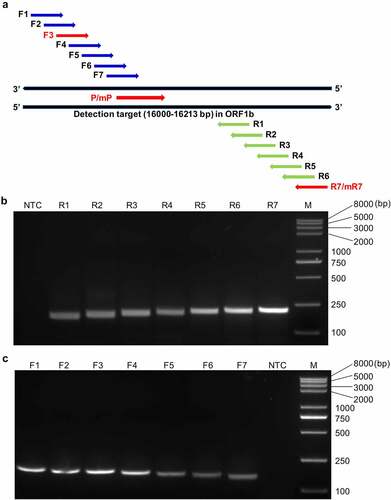
Figure 3. Performance evaluation of the primer-probe combinations screened for use in the RT-RAA-LFD assay for PDCoV detection. The amplification performance of the optimized primer-probe combinations F3/R7/P and F3/R6/P was assessed in the RT-RAA-LFD assay using an RNA template corresponding to 1.6 × 10² TCID50 PDCoV. A no-template control (NTC) was included in each run. The reactions were performed at 40 °C for 10 min. The amplification products were visualized at room temperature using the prepared LFD. The primer-probe combinations are marked at the top of each strip. C and T represent the control and test lines, respectively.
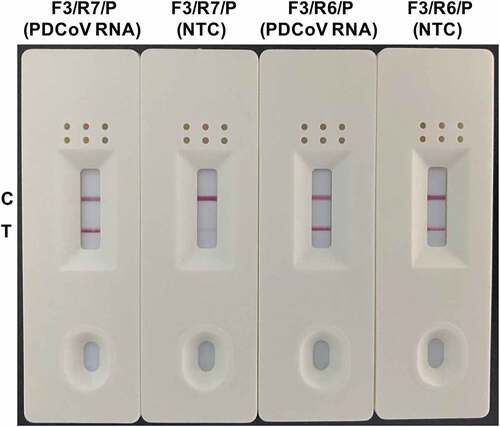
Figure 4. Elimination of false positives in the RT-RAA-LFD assay by introducing base substitutions into the primer-probe sets. (a) Matching bases that may be implicated in cross-dimer formation among the nfo probe P, the optimal reverse primer R7, and the suboptimal reverse primer R6 are marked with blue vertical lines. Bases G and A at positions 4 and 27 in the original probe P were mutated to C and G, respectively, and are marked in red in the mutated probe mP. Base T at position 25 in the original reverse primer R7 (corresponding to position 6 [base A] in the reverse complement sequence of R7) was mutated to C and is marked in red in the mutated mR7. (b) the amplification performance of the original primer-probe set F3/R7/P and the optimized primer-probe set F3/mR7/mP was evaluated in the RT-RAA-LFD assay using the RNA template corresponding to 1.6 × 10² TCID50 PDCoV. A no-template control (NTC) was included in each run. The amplifications were performed at 40 °C for 10 min. The amplification products were visualized at room temperature using the prepared LFD. The primer-probe sets are indicated at the top of each strip. The control and test lines are denoted on the left side.
![Figure 4. Elimination of false positives in the RT-RAA-LFD assay by introducing base substitutions into the primer-probe sets. (a) Matching bases that may be implicated in cross-dimer formation among the nfo probe P, the optimal reverse primer R7, and the suboptimal reverse primer R6 are marked with blue vertical lines. Bases G and A at positions 4 and 27 in the original probe P were mutated to C and G, respectively, and are marked in red in the mutated probe mP. Base T at position 25 in the original reverse primer R7 (corresponding to position 6 [base A] in the reverse complement sequence of R7) was mutated to C and is marked in red in the mutated mR7. (b) the amplification performance of the original primer-probe set F3/R7/P and the optimized primer-probe set F3/mR7/mP was evaluated in the RT-RAA-LFD assay using the RNA template corresponding to 1.6 × 10² TCID50 PDCoV. A no-template control (NTC) was included in each run. The amplifications were performed at 40 °C for 10 min. The amplification products were visualized at room temperature using the prepared LFD. The primer-probe sets are indicated at the top of each strip. The control and test lines are denoted on the left side.](/cms/asset/1ed1f578-a5e9-44f9-b7ce-a6101e618fb0/kvir_a_2116157_f0004_oc.jpg)
Figure 5. Optimization of the RT-RAA-LFD assay reaction conditions for PDCoV detection. (a) Reaction temperature optimization. RT-RAA reactions were run at 20 °C, 25 °C, 30 °C, 35 °C, 37 °C, 40 °C, and 42 °C for 20 min using RNA template corresponding to 1.6 × 10² TCID50 PDCoV and the F3/mR7/mP primer-probe combination. The amplification products were visualized at room temperature with the prepared LFD. (b) ImageJ densitometry of the signal intensities at the control (C) and test (T) lines in the LFD and calculation of their relative densitometric ratios. (c) Reaction time optimization. RT-RAA reactions were run at 40 °C for 0 min, 2 min, 5 min, 10 min, 15 min, 20 min, 25 min, and 30 min using RNA template corresponding to 1.6 × 10² TCID50 PDCoV and the F3/mR7/mP primer-probe combination. The amplification products were visualized at room temperature with the prepared LFD. (d) ImageJ densitometry of the signal intensities at the C and T lines in the LFD and calculation of their relative densitometric ratios.
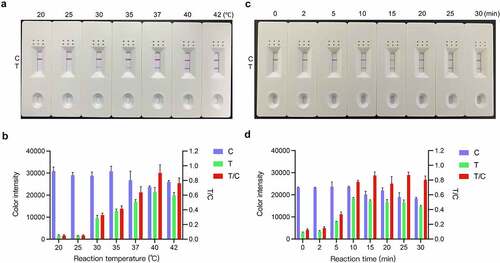
Figure 6. Specificity analysis of the RT-RAA-LFD assay optimized for PDCoV detection. Nucleic acids extracted from PEDV, TGEV, PRoV, PEAV, FMDV, PRRSV, PRV, and PCV2 were tested by the optimized RT-RAA-LFD assay at 40 °C for 10 min and using the optimal F3/mR7/mP primer-probe combination. A positive control (1.6 × 10² TCID50 PDCoV RNA) and a no-template control (NTC) were included.
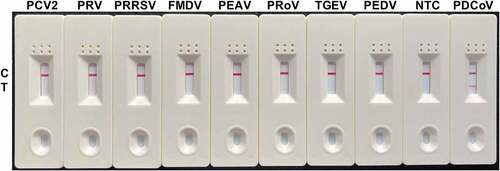
Figure 7. Sensitivity analysis of the RT-RAA-LFD assay optimized for PDCoV detection. (a) the optimized RT-RAA-LFD assay was performed to detect tenfold serial PDCoV RNA dilutions. Dipsticks 1 − 12 represent 1.6 × 10⁷–1.6 × 10˗3 TCID50/mL PDCoV RNA and the no-template control (NTC), respectively. (b) Probit regression analysis in SPSS Statistics v. 26.0 of the RT-RAA-LFD assay of the data for eight independent runs of 1.6 × 10⁷–1.6 × 10 −3 TCID50/mL PDCoV RNA dilutions. The 1.6 × 10⁷–1.6 × 10⁴ TCID50/mL PDCoV RNA dilutions tested positive in 8/8 runs. The 1.6 × 10³ TCID50/mL PDCoV RNA dilutions tested positive in 7/8 runs. The 1.6 × 10² TCID50/mL PDCoV RNA dilutions tested positive in 1/8 runs. The 1.6 × 101–1.6 × 10˗3 TCID50/mL PDCoV RNA dilutions tested positive in 0/8 runs. The 95% LOD (103.599 TCID50/mL PDCoV RNA/reaction) is depicted by a rhomboid. (c) the ORF1b-based trRT-PCR assay was conducted to detect tenfold serial PDCoV RNA dilutions. Curves 1 − 12 represent 1.6 × 10⁷–1.6 × 10˗3 TCID50/mL PDCoV RNA dilutions and the no-template control (NTC), respectively. (d) Probit regression analysis in SPSS Statistics v. 26.0 of the ORF1b-based trRT-PCR assay of the data for eight independent runs of 1.6 × 10⁷–1.6 × 10˗3 TCID50/mL PDCoV RNA dilutions. The 1.6 × 10⁷–1.6 × 10³ TCID50/mL PDCoV RNA dilutions tested positive in 8/8 runs. The 1.6 × 10² TCID50/mL PDCoV RNA dilutions tested positive in 7/8 runs. The 1.6 × 101 TCID50/mL PDCoV RNA dilutions tested positive in 4/8 runs. The 1.6 × 10°–1.6 × 10˗3 TCID50/mL PDCoV RNA dilutions tested positive in 0/8 runs. The 95% LOD (102.366 TCID50/mL PDCoV RNA/reaction) is indicated by a rhomboid.
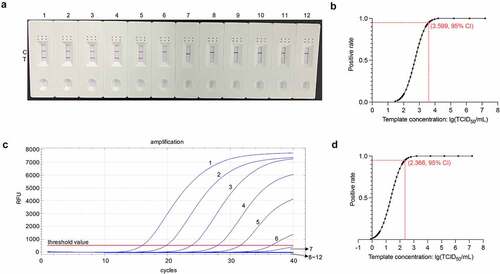
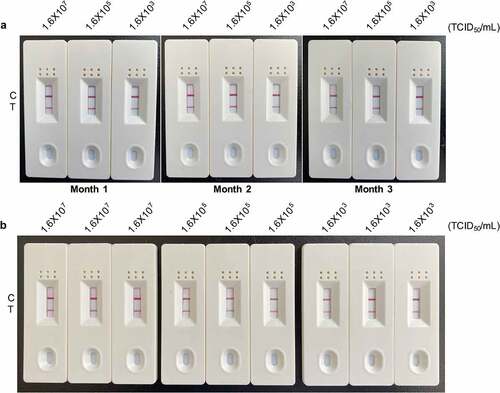
Figure 8. Reproducibility and repeatability analyses of the RT-RAA-LFD assay optimized for PDCoV detection. (a) Inter-assay reproducibility test. High, medium, and low PDCoV RNA concentrations (1.6 × 10⁷ TCID50/mL, 1.6 × 10⁵ TCID50/mL, and 1.6 × 10³ TCID50/mL) were tested by the optimized RT-RAA-LFD assay in triplicate in three independent runs on RNA templates extracted each month for 3 mo. (b) Intra-assay repeatability test. High, medium, and low PDCoV RNA concentrations (1.6 × 10⁷ TCID50/mL, 1.6 × 10⁵ TCID50/mL, and 1.6 × 10³ TCID50/mL) were tested by the optimized RT-RAA-LFD assay as nonuplicate reactions in a single run conducted at a single time point. Control (C) and test (T) lines are labelled on the left side of the dipsticks.
Supplemental Material
Download Zip (18.8 MB)Data availability statement
All relevant experimental data are available either in the text or in the supplementary materials. Detailed information for PDCoV, PEDV, PDCoV, TGEV, PRoV, PEAV, FMDV, PRRSV, PRV, and PCV2 are available to the public under GenBank accession numbers cited in Materials and Methods section.