
Figures & data
Table 1. The information of PICGs identified in the SC84 interaction groups.
Table 2. The information of PIRGs identified in the SC84 interaction groups.
Figure 1. Cog analysis of DEGs in the sc84 interaction groups. A. Upregulated DEGs in the 2 h post-interaction group. B. Downregulated DEGs in the 2 h post-interaction group. C. Upregulated DEGs in the 4 h post-interaction group. D. Downregulated DEGs in the 4 h post-interaction group. The subgroups of cog are indicated in the bars with different colour.
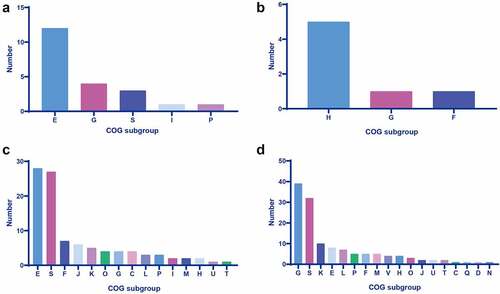
Figure 2. Survival curves of mice injected with 1 × 10⁷ CFU of wild-type strain SC84, △UDC14 mutant, △UDC15 mutant, △UDC16 mutant, △UDC20 mutant, and PBS only as control group (A). Survival rates were calculated via the Kaplan–Meier method. The experiment was performed independently in duplicate. Mean of survival rates were present. The survival rates of different groups were compared using Log-rank test. # significant difference in survival level between the infected group and control group. * significant difference in survival level between the mutant and SC84 infected group. Production of proinflammatory cytokines IL-6 (B) and TNF-α (C) in serum and bacterial loads in peripheral blood (D) of C57BL/6 mice at 8 h post infected with 1 × 10⁶ CFU of wild-type strain SC84 and △udcs mutants. The experiment was repeated twice with similar results. Median of cytokine levels in serum were presented. Peripheral blood bacterial loads were presented in median with interquartile range. Statistical analysis of the cytokine and bacterial counts was performed using the Wilcoxon two-sample test. p <0.05 was considered significant. * the cytokine levels were significantly higher than those of mice infected with wild-type strain SC84. § the cytokine levels were significantly lower than those of mice infected with wild-type strain SC84. # the bacterial loads in blood were significantly lower than those of mice infected with wild-type strain SC84.
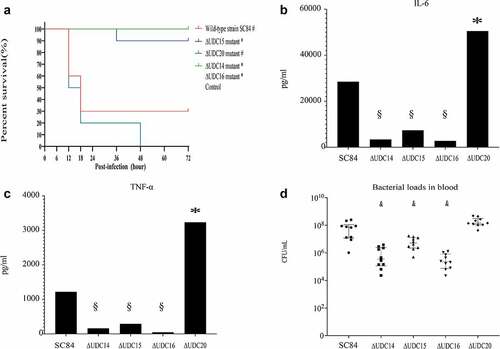
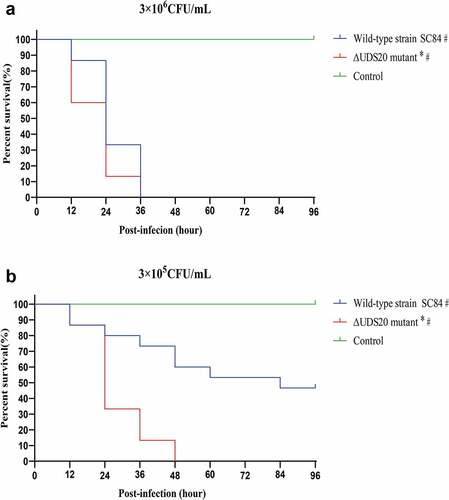
Figure 3. Survival curves of zebrafish infected with 3 × 10⁶ CFU (A) and 3 × 10⁵ CFU (B) of wild-type strain SC84 and △UDC20 mutant. PBS only was used in control group. Survival rates were calculated via the Kaplan–Meier method. The experiment was performed independently in duplicate. Mean of survival rate were presented. The survival rates of different groups were compared using Log-rank test. #, significant difference in survival level between infected group and control group. *, significant difference in survival level between △UDC20 mutant and wild-type strain SC84 infected groups. P < 0.05 was considered significant.
Supplemental Material
Download Zip (782 KB)Data availability statement
The sequence of the genome sequenced in the study was deposited in the GenBank under accession number PRJNA822771. The transcriptome data obtained in the study were deposited in the GenBank under accession numbers SRR18778325-SRR18778333, SRR18778712 -SRR18778724, and SRR18779406-SRR18779417. The data supporting the results presented in the study are available from the corresponding author upon reasonable request.