
Figures & data
Figure 1. Effects of A. caviae infection on IL-1β secretion. (a) Mice were infected with A. cavaie by gavage at a dose of 8 × 10⁹ CFU/mice once a week for 2 weeks and the IL-1β levels in serum from healthy individuals (n = 5) and A. caviae infection mice (n = 5) were measured by ELISA. (b) PMs were inoculated with A. caviae (MOI = 40) for 12 h and the transcript levels of cytokines were determined by qPCR. Differences represented between the A. caviae infection group and unstimulated control group. (c) the IL-1β levels in the culturing supernatant from PMs inoculated with A. caviae at MOI of 40 for 12 h was detected by ELISA. A. hydrophila stimulation (MOI = 1 and 12 h) was set as the positive control.
Figure 2. NLRP3 inflammasome mediated the A. caviae-induced IL-1β secretion. PMs were inoculated with A. caviae at a MOI of 40 for 12 h. (a) the mRNA expressing levels of Nlrs were evaluated by qPCR. Differences represented between the A. caviae infection group and unstimulated control group. (b, c) the NLRP3 protein level was explored by Western Blot and combined with relative grey value to β-actin. (d, e) Immunofluorescence observation of NLRP3 protein (green) and ASC protein (red), and the nucleus were stained in blue. (f) DSS cross link assays showed the ASC oligomerization with anti-ASC antibody during A. caviae infection. (g) PMs were pretreated with MCC950 for 1 h before A. caviae inoculation (MOI = 40) for 12 h. The IL-1β levels was determined by ELISA.
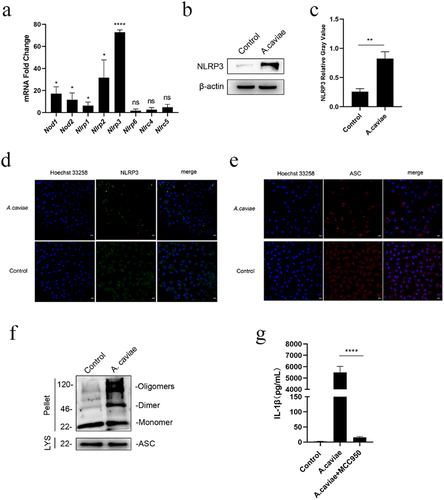
Figure 3. A. caviae activated NLRP3 inflammasome and induced IL-1β secretion in dose- and time-dependence. (a, b) PMs were stimulated with A. caviae at different MOIs of 10, 20, 40 for 12 h. The protein levels of caspase-1 p20 and IL-1β in the supernatant (sn), as well as pro-caspase-1, pro-IL-1β, nlrp3 and β-actin in lysates (lys) was detected and grey analysis was carried out. (c, d) A. caviae infected PMs for different timescales of 4 h, 8 h, 12 h (moi = 20). The caspase-1 p20 and IL-1β in the SN, as well as pro-caspase-1, pro-IL-1β and NLRP3 in the LYS were detected and grey analysis was carried out.
Figure 4. IL-1β was mediated by active caspase-1 and NLRP3 inflammasome dependent on K+ efflux and cathepsin B release. (a-d) PMs were pre-treated with VX765 for 1 h or without pretreatment and then stimulated with A. caviae at a MOI of 40 for 12 h. The protein levels of caspase-1 p20 and IL-1β in the SN, as well as pro-caspase-1 and β-actin in the LYS were measured, and grey analysis was made. (e-g) After 1 h pretreatment with MCC950, CA074-Me and Glyburide (Gly), PMs were infected with A. caviae for 12 h, the protein levels of caspase-1 p20 and IL-1β in the SN, as well as pro-caspase-1 and β-actin in the LYS were measured, and relative grey values were analysed.
Figure 5. A. caviae-induced IL-1β secretion was partly dependent on TLR2. (a) After A. caviae infection for 12 h at a moi of 40, the cell lysates were prepared and subjected to qPCR assay for determining the Tlrs expression. (b, c) the TLR2 protein level in cell lysates was measured by Western Blot and quantified through relative grey value analysis to β-actin. (d) PMs from wild type (wt) or TLR2−/− mice were stimulated with A. caviae for 12 h (moi = 40) and the supernatant was collected for il-1β secretion level determination by elisa.
Figure 6. NF-κB was activated during A. caviae infection and regulated the pro-IL-1β production partly dependent on TLR2. (a) PMs were incubated with A. caviae at a MOI of 40 for 4 h. Subcellular localization of p-p65 (green) and nucleus (blue) was detected by immunofluorescence assay. (b-d) the protein levels of p-p65, p-IKBα and β-actin were detected, and qualified through relative grey value to β-actin. (e-g) WT or TLR2−/− PMs were infected with A. caviae at a MOI of 40 for 4 h followed by the protein level analysis of p-p65, p-IκBα and β-actin. (h, i) PMs from WT (pretreatment with BAY11–7082 for 1 h) or TLR2−/− mice were infected with A. caviae for 4 h and the protein levels of pro-IL-1β were detected, and quantified by relative grey value analysis.
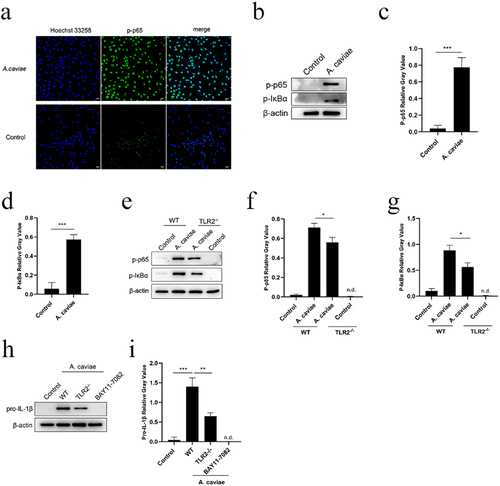
Figure 7. The roles of TLR2, NF-κB, and NLRP3 inflammasome in IL-1β release and cytokines of TNF-α and IL-6 secretion. PMs from TLR2−/−, NLRP3−/− and Caspase-1/11−/− mice as well as WT mice pretreated by BAY11–7082, CA-074 Me or Glyburide (Gly) were infected with A. caviae at a MOI of 40 for 12 h and ELISA assays were utilized to analyse the levels of IL-1β (a), TNF-α (b) and IL-6 (c) in the supernatant.
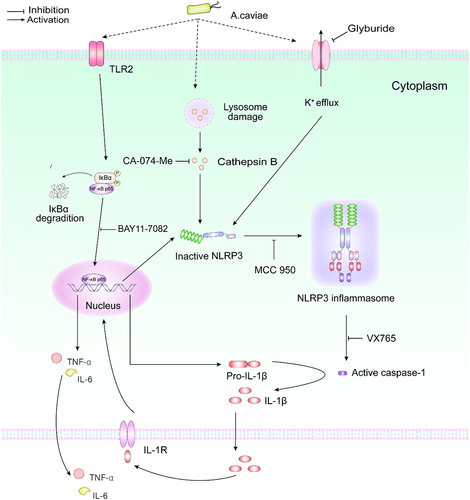
Figure 8. The molecular mechanism of A. caviae infection induced IL-1β release in PMs.
Supplemental Material
Download MS Word (203.2 KB)Data availability statement
The data are available from the corresponding author Panpan Zhao.