
Figures & data
Figure 1. The nuclear localization of MbovP475. (a) the localization of MbovP475 encoded by pEGFP-475 plasmid in BoMac was detected by fluorescence microscopy at 24 h post-transfection. The cells transfected with pEGFP-280 served as negative control. (b, c) Nuclear location of MbovP475 was verified by western blotting assay. The cell fractions of BoMac were extracted and resolved with SDS-PAGE at 3, 6 and 12 h post-infection with M. bovis or treatment with rMbovp475. Then, the proteins were transferred onto PVDF membrane and immunodetected with the antibody directed against MbovP475. NOX served as marker for M. bovis. α-tubulin and PARP served as markers for the cytosolic and nuclear fractions, respectively. (d) Visualization of MbovP475 expression in T9.55 (MbovP475 knock-out mutant) and CT9.55 (MbovP475 complemented strains) with western blotting assay. Wild-type strain HB0801 was used as the positive control. (e) Growth curves of HB0801, T9.55, and CT9.55 strain. Growth of M. bovis at each time point was determined with a plating assay. (f) the nuclear localization of MbovP475 in BoMac at 12 h post-infection with M. bovis strains was verified by western blotting assay, as described above.
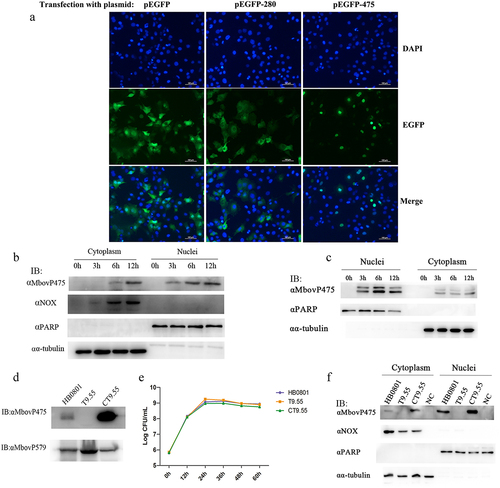
Table 1. The prediction of TALE-like nucleomodulins in M. bovis.
Figure 2. The aa 1–13 fragment of MbovP475 functions as a nuclear localization signal. (a) the schematic diagram shows the MbovP475 deletion in various constructs used for transfection. The aa 1–13 (green box) and aa 28–38 (green box) fragments were predicted as NLS by SeqNLS. plasmids pEGFP-475, pEGFP-475−/−, pEGFP-475−/+, and pEGFP-475± express full length MbovP475, truncated MbovP475 missing aa 1–13 and aa 28–38, truncated MbovP475 missing aa 1–13, and truncated MbovP475 missing aa 28–38 respectively. (b) the localization of MbovP475 in Bomac cells was detected by confocal microscopy at 24 h post-transfection with the above plasmids. (c) the localization of MbovP475 in HEK293T was detected by confocal microscopy at 24 h post-transfection with the above plasmids. The cells transfected with pEGFP-280 served as negative control. The aa 1–13 fragment is essential for MbovP475 to enter the nucleus of BoMac. pEGFP and blank mean cells transfected with empty vector and PBS respectively.
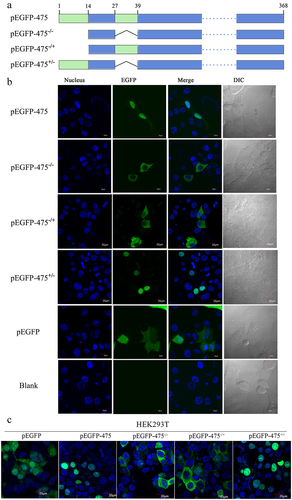
Figure 3. MbovP475 decreased BoMac cell viability. (a) the relative cell viability of BoMac infected with M. bovis was detected by CCK-8. BoMac cells infected with M. bovis HB0801, T9.55, or CT9.55 strains at an MOI of 5 for 12 h, 24 h, and 36 h. (b, c) the cell proliferation of BoMac infected with M. bovis at an MOI of 5 for 24 h was detected by EdU assay. The nuclei of proliferative cells were stained with EdU (green), and the nuclei of all cells stained with Hoechst (blue). The percentage of cells stained by EdU of each group (mean and SEM, n = 5) was calculated by Image-Pro plus 6.0 software. (d, e) the cell cycle of BoMac infected with M. bovis at an MOI of 5 for 24 h was detected by flow cytometry. The DNA content of cells was stained with PI and detected. The percentage of cells in G1 phase, S phase, and G2/M phase of each group was calculated and compared (mean and SEM, n = 3). The data of a and E were analysed with one way ANOVA and Tukey’s test while data of c with Two-tailed Student’s t-test. *p <0.05 and **p <0.01 indicate statistically significant differences; ns indicates no difference.
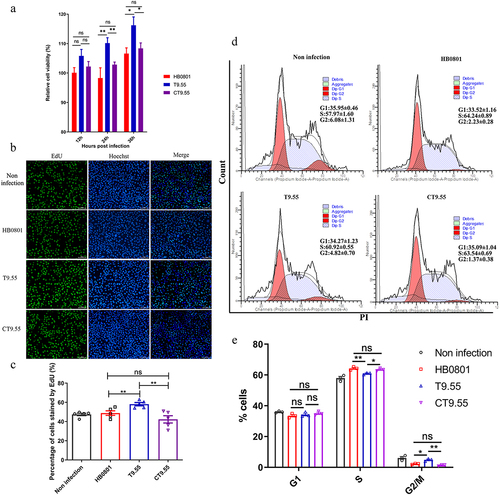
Figure 4. Transcriptional regulation of target genes by MbovP475. (a) the mRNA levels of ILDR1, AMIGO1, MCF2L2, RBM17, HMGB1, IGFBP7, and CRYAB in BoMac at 12 h post-infection with M. bovis (MOI = 5) were detected by RT-PCR. (b) the mRNA levels of above target genes in BoMac at 12 h post-infection with M. bovis (MOI = 500) were detected by RT-PCR. The data of a and B (mean and SEM; n = 4) were analysed with one way ANOVA and Tukey’s test, *p <0.05, **p <0.01, ***p <0.001 indicate statistically significant differences; ns indicates no difference. (c) the expression of CRYAB and MCF2L2 in BoMac at 24 h post-infection with M. bovis (MOI = 5) was detected by western blotting assay. (d) Luciferase reporter assay on transcription-regulating activity of potential target genes in HEK293T cells by MbovP475. The cells co-transfected with 1 μg promoter-pGL3-Basic and 1 μg pCAGGS vector encoding HA, HA-MbovP475, or HA-MbovP475Δ1-13. the empty pGL2-Basic vector was used as the negative control. Resultant luciferase activities were expressed as relative luciferase activities normalized to the pRL-TK activity and shown as mean ± SEM from three independent experiments. Two-tailed Student’s t-test was used, *p <0.05, **p <0.01, ***p <0.001 indicate statistically significant differences; ns indicates no difference.
Table 2. The screening of proliferation associated genes potential regulated by MbovP475.
Figure 5. The verification of interaction between MbovP475 and promoter fragments. (a) EMSA analysis of the interaction between MbovP475 and the promoter region of MCF2L2 (+53 bp to +112bp from TSS) or CRYAB (+108 bp to + 167 bp from TSS) using 5 μg MbovP475 incubated with 50 fmol promoter fragment of target genes. The CRYAB promoter region (−120 bp to − 61 bp from TSS) served as negative control to demonstrate specific binding. (b, c) Determination of the affinity and kinetics of molecular interaction by SPR. About 100 RU MbovP475 captured on a charged NTA sensor chip and test promoter fragments at five concentrations between 0.5 and 8 nM. (d) the amino acid residue positions of MbovP475 potentially involved in interaction with the promoter fragment were predicted by DP-bind (red bars). (e) the schematic diagram shows the truncation of MbovP475 used in Southwestern blotting assay. The MbovP475∆db1, MbovP475∆db2, and MbovP475∆db3 represent the truncated MbovP475 missing the predicted DNA-binding amino acid residues. (f) Identification of DNA-binding region of MbovP475 by Southwestern blotting assay. 2 μg of MbovP475, MbovP475∆db1, MbovP475∆db2, and MbovP475∆db3 were resolved with SDS-PAGE and transferred to nitrocellulose membranes. The samples were then incubated with 20 pmol biotin labelled promoter fragments at room temperature for 12 h after renaturation in TNED buffer.
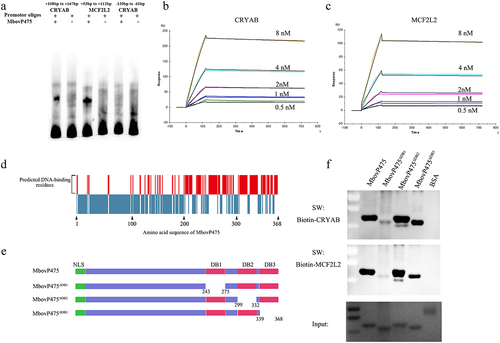
Figure 6. Confirmation of DB1 domain essential for MbovP475’s inhibition of cell proliferation. (a) the cell proliferation of BoMac treated with 1 μM rMbovp475, rMbovp475ΔDB1, and rMbovp475ΔDB2 for 24 h was detected with EdU assay. Cells treated with PBS served as negative control. The nuclei of proliferative cells stained with EdU (green), and the nuclei of all cells stained with Hoechst (blue). (b) the percentage of cells stained by EdU in each group (mean and SEM, n = 5) was calculated in Image-Pro plus 6.0 software. Two-tailed Student’s t-test was used, *p <0.05, **p <0.01, ***p <0.001 indicate statistically significant differences; ns indicates no difference. (c) the expression of MCF2L2 and CRYAB in the cells treated with 1 μM rMbovp475, rMbovp475ΔDB1, and rMbovp475ΔDB2 for 24 h. The cells treated with PBS served as negative control.
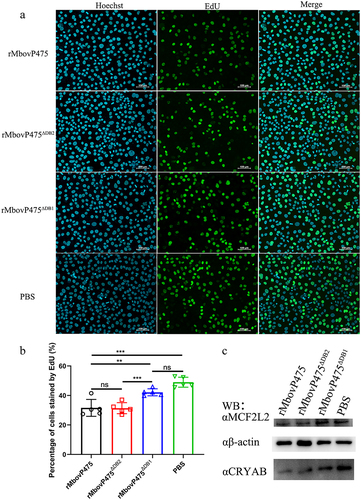
Figure 7. Determination of DNA-binding sites of MbovP475. (a) the analysis on conserved amino acid residues of MbovP475 DB1 domain with MolliGen. The conserved amino acid residues were marked with black boxes. (b) the secondary structure analysis on MbovP475 DB1 domain with Jpred 4. The predicted DNA-binding residues in the loop region between two-helix were marked with black boxes. (c) the interaction between mutated MbovP475 and DNA. 2 μg MbovP475 and its mutants were resolved with SDS-PAGE and transferred to nitrocellulose membranes and incubated with 20 pmol biotin labelled promoter fragments at room temperature for 12 h. Then the bands were detected by Streptavidin-Horseradish Peroxidase Conjugate. (d) the relative ratio of the integrated density value of band on the membrane to the integrated density value of band on the polyacrylamide gel. (e) the expression of mutated MbovP475 in complementary strains was detected by western blotting assay. The MbovP579 served as control. The expression of CRYAB (f) and MCF2L2 (g) in BoMac at 12 h post-infection with M. bovis (MOI = 5) was detected by qRT-PCR. Results were normalized to β-actin mRNA and shown as mean ± SEM from three independent experiments. Two-tailed Student’s t-test was used, *p <0.05, **p <0.01, ***p <0.001 indicate statistically significant differences; ns indicates no difference. (f, g; mean and SEM; n = 3).
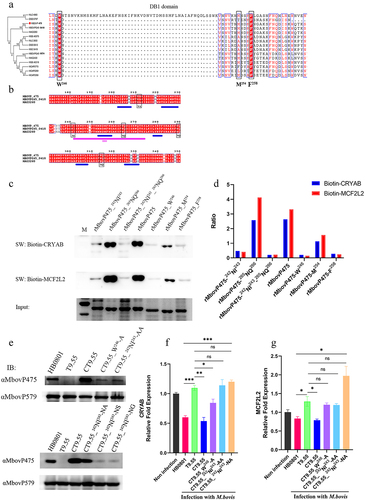
Figure 8. MbovP475 inhibition of cell viability by down regulation of MCF2L2 and CRYAB. (a, b) the expression of MCF2L2 and CRYAB in BoMac at 24 h post-transfection with siRNA was detected by qRT-PCR and western blotting assays. (c, d) the cell viability of cryab-knockdown or mcf2l2-knockdown BoMac cells infected with M. bovis. The cell viability of BoMac at 24 h post-infection with M. bovis (MOI = 5) was determined by crystal violet assay. One way ANOVA and Tukey’s test were used, *p <0.05, **p <0.01, ***p <0.001 indicate statistically significant differences. Data are representative one experiment of three independent biological replicates.
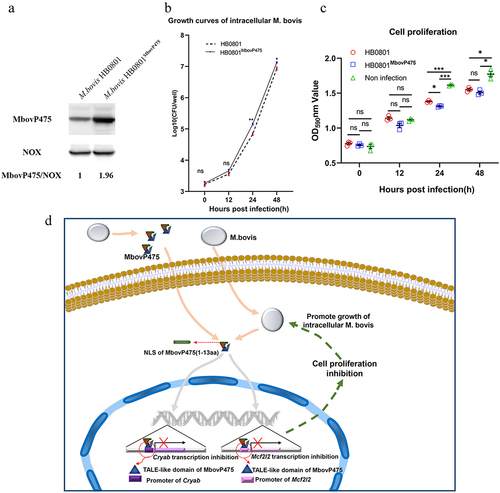
Figure 9. MbovP475 promoted the growth of intracellular mycoplasma. (a) the overexpression of MbovP475 in the M. bovis HB0801MbovP475 strains. The expression of MbovP475 in strains was detected by western blotting assay with the polyclonal antibodies against MbovP475. The NOX of M. bovis served as control. (b) the titres of intracellular M. bovis. The cells were infected with M. bovis and treated with gentamicin (400 μg/mL), and determined the CFU/well at 0, 12, 24, and 48 h post-infection. (c) Cell viability of BoMac infected with M. bovis HB0801MbovP475 or M. bovis HB0801. The cells were infected with M. bovis and treated with gentamicin (400 μg/mL), and wells were washed once with PBS and stained with 0.5% crystal violet solution at 0, 12, 24, and 48 h post-infection. Then, 1 mL of 95% ethanol was added to each well and incubated for 2 h after washing and air-drying. Then the optical density (OD) was measured at 590 nm. One way ANOVA and Tukey’s test were used, * p <0.05, **p <0.01, and ***p <0.001 and “ns” indicate statistically significant differences and no difference, respectively. Data are representative one experiment of three independent biological replicates. (d) Schematic diagram of the decrease in cell viability by MbovP475. The cell viability was decreased by the MbovP475 secreted by intracellular or extracellular M. bovis via inhibiting CRYAB and MCF2L2 transcription through binding the promoter fragment of these genes.
Supplemental Material
Download Zip (14.7 MB)Data availability statement
The ChIP-seq data have been deposited in the Gene Expression Omnibus (GEO) database under accession code GSE179651.