
Figures & data
Figure 1. Time-Killing curves of the drugs. (a) the fungal cells were exposed to 5 mM NAM and 0.0313 μg/ml AmB alone or in combination. (b) the fungal cells were exposed to 5 mM NAM and 0.0625 μg/ml nystatin alone or in combination. At the time point of 3, 6, 9 and 12 h, portions of the cell suspensions were harvested and plated on YPD agar to calculate the CFU/ml.
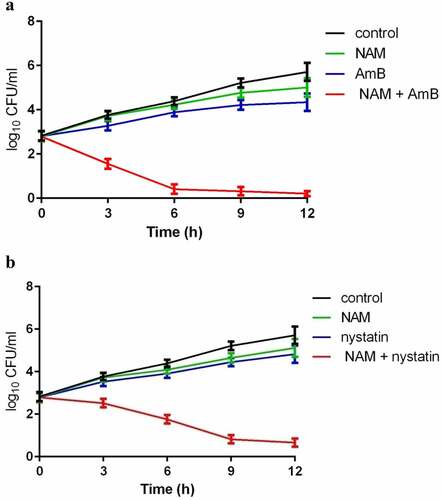
Table 1. Interaction of nicontinamide (NAM) and amphotericin B (AmB) against fungi.
Figure 2. Inhibition of biofilm formation. (a) Effects of 10 mM NAM, 0.5 μg/ml AmB and 0.5 μg/ml nystatin alone or in combination against biofilm. The growth of the biofilm cells were determined by XTT reduction assay. The results are presented as the percent of drug-treated biofilms relative to the control (drug-free) biofilm. (b) Effects of 10 mM NAM, 0.5 μg/ml AmB and 0.5 μg/ml nystatin alone or in combination on biofilms biomass production. *P < 0.05; **P < 0.01 as compared to the control (drug-free) biofilm.
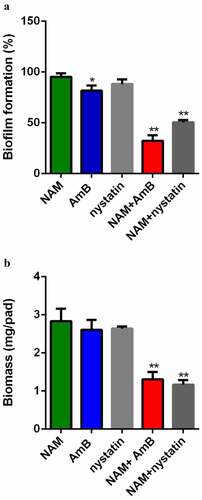
Figure 3. (a) the in vivo interaction of NAM and AmB against C. albicans. (a) Survival curves of the mice. The BALB/c mice were injected with C. albicans SC5314 cells intravenously (0 day). On days 0, 1, 2, 4 and 6, NAM (3.28 mmol/kg) and AmB (0.3 mg/kg) was administered intraperitoneally alone or in combination. The mouse mortality was monitored every day. (b) the mice were sacrificed four days after infection. The kidneys were collected and homogenized. The homogenate was cultured for the calculation of the log reduction in CFU/mg. *P < 0.05; **P < 0.01 as compared to the control (drug-free) group.
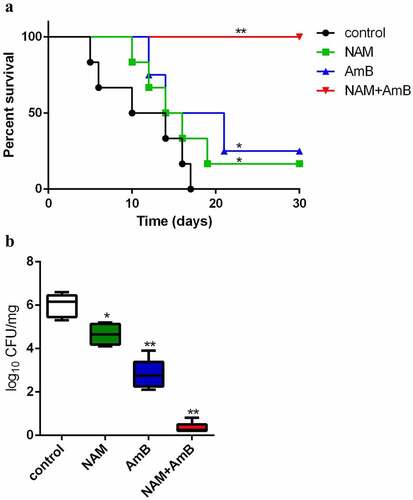
Figure 4. (a) Measurement of ROS production. C. albicans SC5314 cells were exposed to 10 mM NAM and 0.125 μg/ml AmB alone or in combination. The ROS level was measured at the indicated time points by a fluorescence spectrometer. The fluorescence value of the combination group at 12 h was considered as 100 % and other fluorescence values were presented as the percent relative to this value. (b) Measurement of mRNA expression. The fungal cells were exposed to 10 mM NAM and 0.125 μg/ml AmB alone or in combination for 4 h. Gene expression was indicated as the fold increase in the drug-treated groups relative to that of the control (drug-free) group.
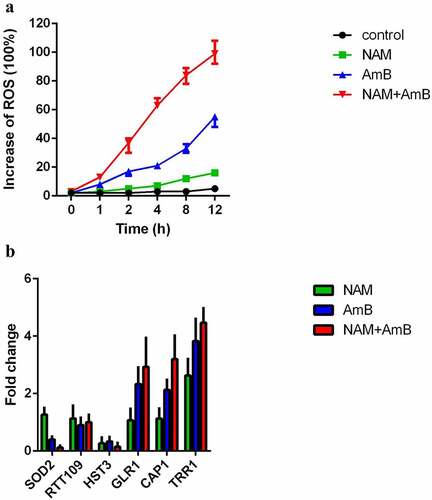
Figure 5. Immunoblot analysis of H3K56ac. C. albicans SC5314 cells were treated by 10 mM NAM and AmB (0.125, 0.25,0.5 and 1 μg/ml) alone or the combination of 10 mM NAM and 0.5 μg/ml AmB for 4 h. Then the protein was extracted, separated by SDS gels and probed with rabbit anti-H3K56ac (top) or rabbit anti-H3 (bottom).
Figure 6. (a) C. albicans wild-type strain (CASS1) and hst3 mutant (hst3δ/ptet-HST3) with or without Doxy were exposed to 10 mM NAM and 0.125 μg/ml AmB alone or in combination for 6 h. The sensitivities of the fungal cells to the drugs were recorded by measuring the OD600 values of the cell suspension. The relative growth refers to the ratio of the OD600 value of the cells in the drug-treated group to the wild-type strain in the control (drug-free) group. (b) Measurement of ROS production. The fungal cells were exposed to 10 mM NAM and 0.125 μg/ml AmB alone or in combination for 12 h. Then the cell samples were taken for ROS measurement with a fluorescence spectrometer. The fluorescence of the hst3 mutant with Doxy (hst3δ/ptet-HST3+Doxy) in the combination group was considered as 100 % and other fluorescence values were presented as the percent relative to this value. *P < 0.05; **P < 0.01 as compared to the same strain in the control (drug-free) group.
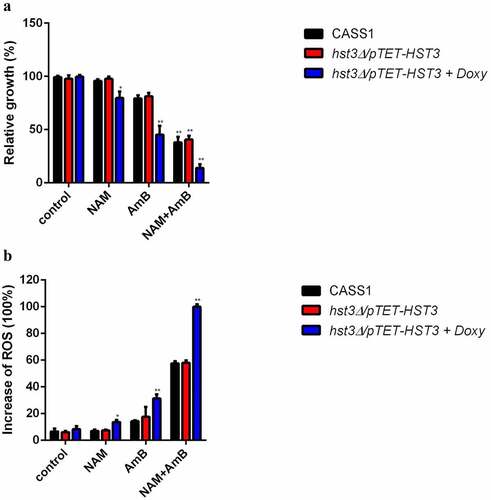
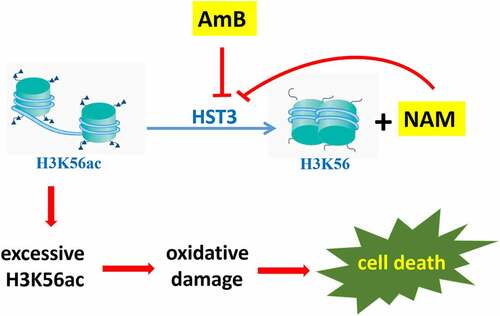
Figure 7. A model explaining the antifungal action of AmB and the synergistic activity between NAM and AmB through epigenetic modification of H3K56ac. AmB could inhibit HST3 expression, which resulted in excessive H3K56ac and the consequent oxidative damage. NAM is a byproduct during the deacetylation course of H3K56ac in C. albicans, and excessive NAM can inhibit this process. The combined addition of NAM and AmB led to even excessive H3K56ac and severe oxidative damage, which resulted in increased cell death. Thus enhanced antifungal activity was observed.
Data availability statement
The authors confirm that the data supporting the findings of this study are available within the article [and/or] its supplementary materials.