
Figures & data
Figure 1. Virulence and growth of H37Rv in Gm. (a) Survival assay of Gm (n = 25, per group) challenged with varying infectious doses of H37Rv. Larval survival was recorded every 24 h for 192 h. Mock infected (PBS-T) larvae were included as controls. (b) In vivo survival of H37Rv (2 x 10⁶ CFU) in Gm (n = > 25) was measured over a 192 h time-course. CFU were enumerated from the Gm homogenate (n = 4, per time-point) to measure changes in the in vivo mycobacterial load over the course of infection. (c and d) survival assay of Gm (n = 25, per group) using varying CFU doses of H37Rv, BCG lux and SAMTB lux, were conducted to determine differences in mycobacterial virulence between the three strains, measured as changes in larval survival. (c) Larval survival was recorded every 24 h for 96 h (1 x 10⁷ CFU for BCG lux and H37Rv and 2 × 10⁷ CFU for SAMTB lux) or (d) 192 h (2 x 10⁶ CFU). All infected larvae were maintained in the dark at 37 °C following infection. All plotted data are the means of three (or four [ - 2 × 10⁶ CFU]) independent experiments, and the error bars represent the SD of the means. Sample size per experiment group were n = 25. Percentage represents final larval survival. The Mantle-Cox Log-rank test with Bonferroni’s correction, (a) carried out against the mock treated (PBS-T) control or (b) respective H37Rv CFU dose, was used. * = p <0.05, ** = p <0.01, *** = p <0.001 and **** = p <0.0001.
![Figure 1. Virulence and growth of H37Rv in Gm. (a) Survival assay of Gm (n = 25, per group) challenged with varying infectious doses of H37Rv. Larval survival was recorded every 24 h for 192 h. Mock infected (PBS-T) larvae were included as controls. (b) In vivo survival of H37Rv (2 x 10⁶ CFU) in Gm (n = > 25) was measured over a 192 h time-course. CFU were enumerated from the Gm homogenate (n = 4, per time-point) to measure changes in the in vivo mycobacterial load over the course of infection. (c and d) survival assay of Gm (n = 25, per group) using varying CFU doses of H37Rv, BCG lux and SAMTB lux, were conducted to determine differences in mycobacterial virulence between the three strains, measured as changes in larval survival. (c) Larval survival was recorded every 24 h for 96 h (1 x 10⁷ CFU for BCG lux and H37Rv and 2 × 10⁷ CFU for SAMTB lux) or (d) 192 h (2 x 10⁶ CFU). All infected larvae were maintained in the dark at 37 °C following infection. All plotted data are the means of three (or four [Figures 1a - 2 × 10⁶ CFU]) independent experiments, and the error bars represent the SD of the means. Sample size per experiment group were n = 25. Percentage represents final larval survival. The Mantle-Cox Log-rank test with Bonferroni’s correction, (a) carried out against the mock treated (PBS-T) control or (b) respective H37Rv CFU dose, was used. * = p <0.05, ** = p <0.01, *** = p <0.001 and **** = p <0.0001.](/cms/asset/381b8adb-3d7a-41ea-83ec-d942abace10e/kvir_a_2119657_f0001_oc.jpg)
Figure 2. Interaction of H37Rv and Gm haemocytes. TEM was undertaken on haemocytes extracted from H37Rv (2 x 10⁶ CFU) infected larvae at (a) 1 h, (b) 24 h, (c) 96 h, (d) 144 h and (e) 192 h post-infection (pi). (f) Haemocytes of uninfected larvae and (g) H37Rv were used as the controls. (a) as early as 1 h pi, H37Rv bacilli (blue arrowheads) were internalised by the phagocytic haemocytes. (b) at 24 h pi, small clusters of H37Rv bacilli (blue arrowheads) were contained by aggregates of haemocytes. (c) by 96 h pi, early GLS surrounding a central mass of mycobacteria (highlighted in blue) were visible. (d-e) Abundance of intracellular bacilli (d, highlighted in blue) were observed in increasing frequency with the progression of disease. (e) by 192 h pi, haemocytes were primarily necrotic, losing cell integrity with leakage of intracellular materials and bacilli. N = nucleus. Scale bars represent a, e: 1 μm, c, d: 2 μm, b, f: 4 μm and g: 400 nm.
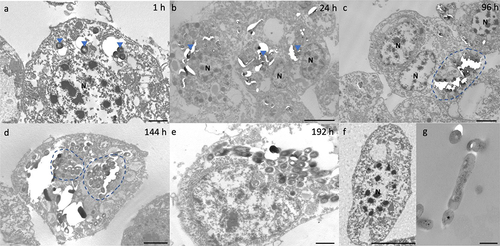
Figure 3. Formation of granuloma-like structures (GLS) in Gm infected with H37Rv. Sagittal histological sections of Gm infected with H37Rv (2 x 10⁶ CFU) at (a) 24 h, (b) 96 h and (c) 144 h post-infection. ZN stained sections highlights GLS (black arrows) observed in increasing abundance and size over the course of infection . FB = fat body, GI = gastrointestinal tract, and red downward triangle = trachea. Scale bar represents 1000 μm.
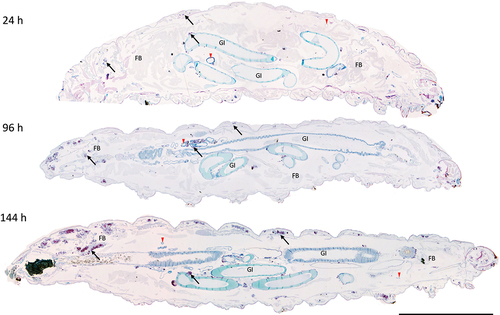
Figure 4. Histological analysis of Gm-H37Rv infection. Histological tissue sections of larvae infected with H37Rv (2 x 10⁶ CFU) were prepared and processed for H&E (a, c, e, g, i, and k) or ZN (b, d, f, h, j, and l) staining. Granuloma-like structures (GLS) were visualised at 24 h (a, b), 48 h (c, d), 96 h (e,f) 144 h (g, h) 192 h (i-l) post-infection. The complexity of host cell arrangement forming the GLS varied from (a, b) organised to (c, d) unstructured. The physical state of H37Rv bacilli contained within the GLS varied over time with mixtures of individually distinct active clusters of bacilli of varying size (bright pink) or densely packed highly ZN-reactive amorphous material released from dead/dying bacilli (dark purple). Loss in ZN affinity (grey mass) was observed in structures 96 h pi onwards (f, j, l). Cell necrosis, visible in H&E stained sections characterised by cellular fragmentation, loss/fading of nuclear staining, and decreased staining (due to appearance of pale spongy pockets) were observed in the areas associated with densely packed ZN reactive material. Scale bars represents 20 μm for a, b, e, and f; 100 μm for c, d and g-j; 50 μm for k and l.
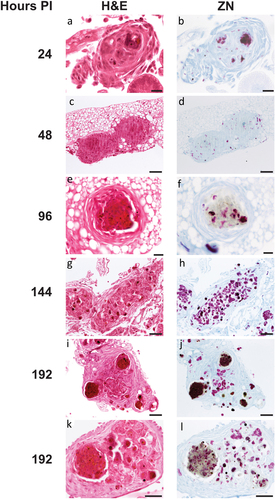
Figure 5. Unique varieties of granuloma-like structures (GLS) found in Gm infected with H37Rv. Magnified images of ZN and H&E stains presented in , highlighting key areas of interest. (a) large aggregates of individually distinct H37Rv bacilli were observed (ZN, circumscribed by black dotted line). A GLS clearly defined as circular eosinophilic area with faded spongy pockets of staining (H&E, circumscribed by white dotted line). (b) a GLS containing dense ZN reactive material, with localised peripheral loss in ZN reactivity as indicated in the area enclosed by the black square. Foci of intense H&E staining most likely indicates host cell necrosis. (c) a GLS associated with predominant loss of ZN reactivity. In contrast to (b), non-ZN reactive masses were associated with less intense H&E staining, and host cell nuclei were more easily distinguishable (as highlighted by the white arrows); likely indicating that the level of host cell necrosis is low despite the presence of mycobacterial mass.
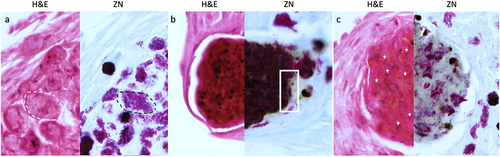
Figure 6. Changes in the total number of circulating haemocytes in Gm infected with H37Rv. (a) the total haemocyte count (THC) was measured from H37Rv (2 x 10⁶ CFU), PBS-T (mock infected), or naïve larvae (n = 4, per time-point) every 24 h over a 192 h time-course, with the exception of 120 h post-infection (pi). Plotted are the means of three independent experiments, and the error bars represent the SD of the means. (b) Changes in THC, relative to larval mortality (as presented in ) and in vivo H37Rv load (as presented in ) of infected larvae (2 x 10⁶ CFU) over the course of 192 h time-course. Suppression of THCs within the first 96- h pi, indicates diversion of circulating haemocytes into sessile state as GLS are formed. However, containment does not eliminate infection, as indicated by the proliferation of H37Rv bacilli during the corresponding time-points. By 96–192 h pi, GLS succumb to the replicating bacilli, leading to a breach in containment, inducing further immune responses as indicated by the rise in THCs back to the t = 0 h level. Nevertheless, the immune response is overloaded by the growth of H37Rv, inducing larval mortality, as indicated by the increase rate of larval mortality over the corresponding time-points.
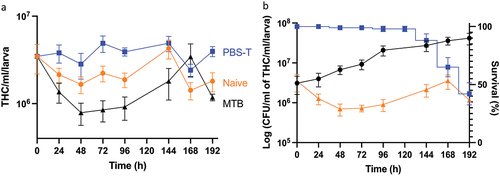
Figure 7. Treatment of H37Rv infected Gm using clinically recommended antimycobacterial compounds. Larvae (n = 25) were infected with H37Rv (2 x 10⁷ CFU) and treated using one of the following antimycobacterial compounds: INH (5 mg/kg), RIF (10 mg/kg), ETH (150 mg/kg) or PZA (250 mg/kg) using concentrations recommended for treatment of adult TB, scaled relative to body mass of the larva (200 mg). ETH and PZA were used at 10x the recommended dosage. Infection was allowed to establish for 72 h prior to treatment. Following infection, larvae were incubated in the dark at 37 °C. (a) INH or RIF treated larvae showed significant improvements in larval survival relative to the mock treated (PBS-T) controls. Larval survival was monitored every 24 h for 120 h post-treatment (or 192 h inclusive of incubation period). (b) All treatments (with the exception of PZA) led to a significant reduction in in vivo H37Rv burden (%), measured via CFU enumeration of H37Rv from homogenised Gm (n = 4, per time-point). Plotted are the means of (a) three or (b) five independent experiments, and the error bars represent the SD of the means. (a) the Mantle-Cox log-rank test with Bonferroni’s correction was carried out against the mock treated (PBS-T) controls. (b) One-way ANOVA test with Holm-šídák multiple comparisons between PBS and treatment: **** (black) = p <0.0001, degree of freedom = 4 and F-value = 43.79. Two tailed unpaired student’s t-test between PT and treatment: *** (red) = p <0.001 **** (red) = p <0.0001.
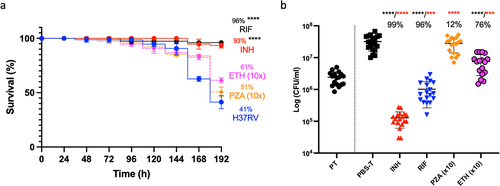
Figure 8. Determining virulence of isogenic mutants ΔphoP and ΔdosR against H37Rv wild-type in Gm. Larvae (n = 25, per group) were challenged with (a) ΔphoP or ΔphoP complement (ΔphoP comp), (b) ΔdosR or ΔdosR complement (ΔdosR comp). Larvae infected with H37Rv wild-type (WT) were utilised as the virulence control. Virulence was assessed via larval survival assay over a 192 h time-course. Infected larvae were maintained at 37 °C in the dark, and survival was recorded every 24 h. All data plotted are the mean of three independent experiments. Percentage represents final larval survival. Error bars represents the SD of the means. The Mantle-Cox log-rank test with Bonferroni’s correction was conducted against the WT. ** = p <0.01 and **** = p <0.0001.
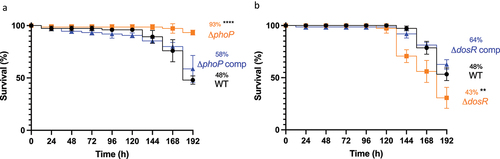
Table 1. List of mycobacterial strains utilized in this study.
Supplemental Material
Download Zip (721.3 KB)Data availability statement
The data supporting the findings of this study are available from figshare with 10.6084/m9.figshare.19668768, under open licence (CC BY 4.0).