Figures & data
Figure 1. pH1N1 infection-induced pathological damage and cytokine storm were infection dose- and time-dependent. (A) Survival rate and (B) body weight change after infection with 102 TCID50 and 106 TCID50 pH1N1. Data are representative of two independent experiments (n = 8 for each group). (C) Lung tissue injury was assessed by H&E staining at 1, 2, 3, and 5 dpi after infecting with 102 TCID50 and 106 TCID50 pH1N1. Scale bar = 100 μm; original magnification = ×200. Semiquantitative histological scoring of lung injury (D) and infiltration (E). The heatmap of the concentration of cytokines and chemokines in the BALF (F) and serum (G) of both doses of infected mice at the indicated dpi. Data are representative of two independent experiments and presented as mean ± SD (n = 3 for each group). In Figure D and E, # and ### represent p <0.05, p <0.001, respectively, when the 102 TCID50 group is compared to the 106 TCID50 group. *** represents p <0.001 when the different dpi of 102 TCID50 and 106 TCID50 are compared to the control group. Ctl = control; dpi = days post infection.
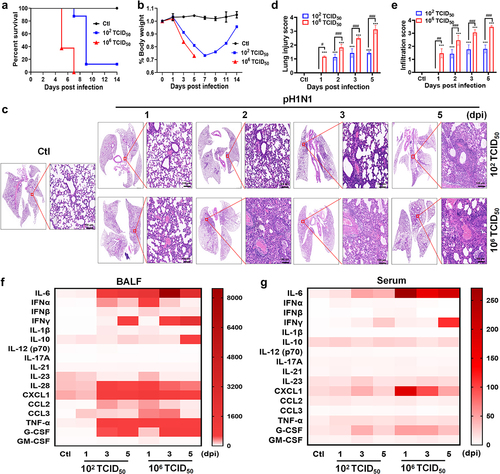
Figure 2. pH1N1 infection dose- and time-dependent recruited neutrophils into the lung. (A and B) the percentages of CD45+CD11b+Ly6G+ neutrophils in the lungs were detected using flow cytometry at 1, 2, 3, and 5 dpi after being infected with 102 TCID50 and 106 TCID50 pH1N1. (C) Representative immunohistochemical images of Ly6G expression in the lungs of mice following both doses at indicated dpi. Scale bar = 100 μm; original magnification = ×200. (D) Quantitative analysis of Ly6G positive cells in the lung slices at the indicated dpi. Data are representative of two independent experiments and presented as mean ± SD (n = 3 for each group). In Figure B and D, # and ### represent p <0.05 and p <0.001, respectively, when the 102 TCID50 group is compared to the 106 TCID50 group. ** and *** represent p <0.01 and p <0.001, respectively, when the different dpi of 102 TCID50 and 106 TCID50 are compared to the control group. Ctl = control; dpi = days post infection.
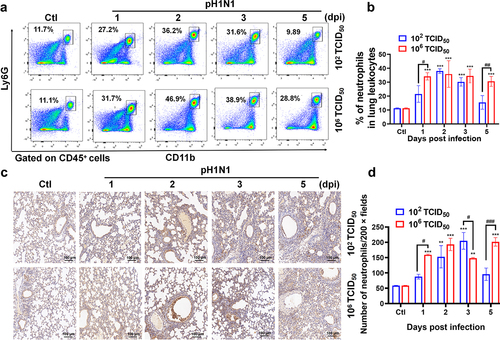
Figure 3. Dose- and time-dependent pH1N1 infection recruited macrophages into the lungs. (A and B) the percentages of CD45+F4/80+ macrophages in the lungs were detected using flow cytometry at 1, 2, 3, and 5 dpi after being infected with 102 TCID50 and 106 TCID50 pH1N1. (C) Representative immunohistochemical images of F4/80 expression in the lungs of mice following both doses at the indicated dpi. Scale bar = 100 μm, original magnification = ×200. (D) Quantitative analysis of F4/80+ cells in the lung slices at the indicated dpi. Data are representative of two independent experiments and presented as mean ± SD (n = 3 for each group). In Figure B and D, # and ### represent p <0.05 and p <0.001, respectively, when the 102 TCID50 group is compared to the 106 TCID50 group. ** and *** represent p <0.01 and p <0.001, respectively, when the different dpi of 102 TCID50 and 106 TCID50 are compared to the control group. Ctl = control; dpi = days post infection.
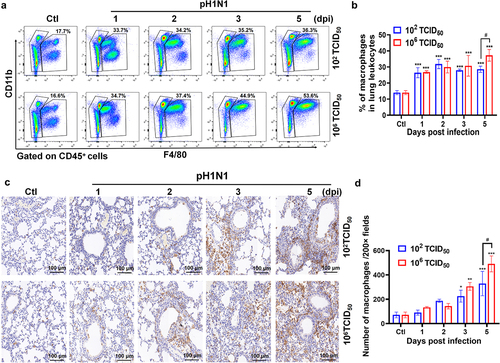
Figure 4. pH1N1 infection dose- and time-dependent induced higher ratio of M1/M2. (A – B) Real-time PCR analysis of Nos2, Tnf-α, and Mrc1 in the lungs of mice at 1, 2, 3, and 5 dpi after being infected with 102 TCID50 and 106 TCID50 pH1N1. (C) The percentages of CD45+F4/80+MHC-II+ and CD45+F4/80+CD206+ macrophages in the lungs were detected using flow cytometry at 6 hpi, 12 hpi, 1 dpi, 2 dpi, 3 dpi, and 5 dpi. (D – E) The histograms show the proportion changes of M1 (F4/80+MHC-II+) and M2 (F4/80+CD206+) at different time points of infection. (F) The ratios of M1/M2 at different time points of infection. Data are representative of two independent experiments and are presented as mean ± SD (n = 3 for each group). In Figure A, B, D, E, and F, #, ##, and ### represent p <0.5, p <0.01, and p <0.001, respectively, when the 102 TCID50 group is compared to the 106 TCID50 group. *, **, and *** represent p <0.5, p <0.01, and p <0.001, respectively, when the different dpi of 102 TCID50 and 106 TCID50 are compared to the control group. Ctl = control; hpi = hours post infection; dpi = days post infection.
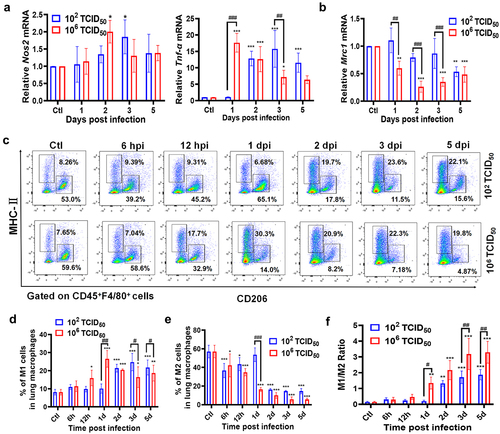
Figure 5. pH1N1 infection dose- and time-dependent activated STAT1 and STAT3. Real-time PCR analysis of the Stat1 (A) and Stat3 (B) in the lungs of mice at 6 hpi, 12 hpi, 1 dpi, 2 dpi, 3 dpi, and 5 dpi after being infected with 102 TCID50 and 106 TCID50 pH1N1. (C) Western blot analysis of p-STAT1 (Tyr701), STAT1, p-STAT3 (Tyr705), and STAT3 expression in the lungs of different treatment groups at the indicated time post infection. (D) The expression of p-STAT1 (Tyr701), STAT1, p-STAT3 (Tyr705), and STAT3 relative to β-actin at the indicated time post-infection of different treatment groups. (E) Representative immunohistochemical images of p-STAT1 (Tyr701) and p-STAT3 (Tyr705) expression in the lungs of mice following both doses at the indicated dpi. Scale bar = 100 μm; original magnification = ×200. (F) Quantitative analysis of p-STAT1 (Tyr701) and p-STAT3 (Tyr705) positive cells in the lung slices at the indicated dpi. Data are representative of two independent experiments and are presented as mean ± SD (n = 3 for each group). In Figure A, B, D, and F, *, **, and *** represent p <0.5, p <0.01, and p <0.001, respectively, when the different dpi of 102 TCID50 and 106 TCID50 are compared to the control group. Ctl = Control; hpi = hours post infection; dpi = days post infection.
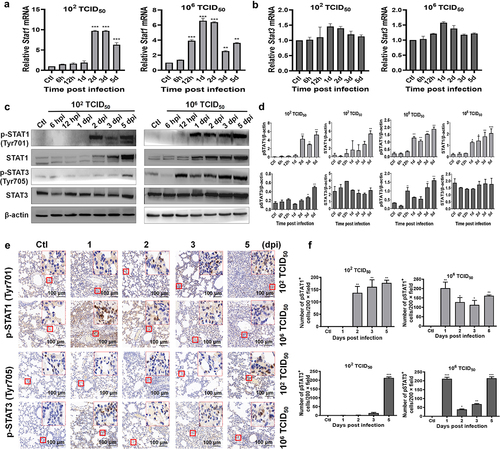
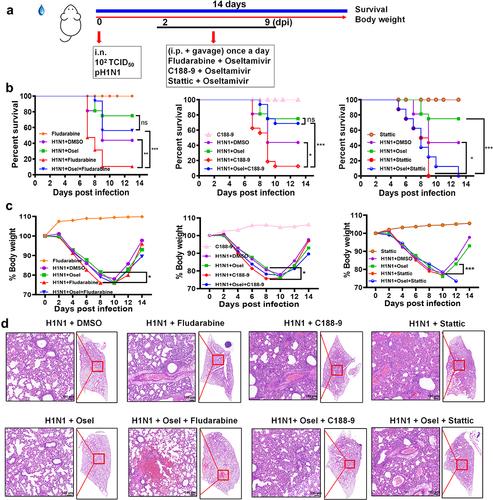
Figure 6. Inhibition of STAT1 and/or STAT3 aggravated low-dose pH1N1 infection-induced lung damage and decreased survival rate. (A) BALB/c mice were infected with 102 TCID50 doses of pH1N1 and treated by different drug combinations at 2 dpi for 7 days. Survival rate (B) and body weight changes (C) following treatment with Fludarabine/C188-9/stattic, DMSO, Oseltamivir, Oseltamivir + Fludarabine, Oseltamivir + C188–9 or Oseltamivir + Stattic. (D) Lung tissue injury was assessed by H&E staining. Data are representative of two independent experiments (n = 8–16 for each group). In Figure B and C, *, **, and *** represent p <0.05, p <0.01, and p <0.001, respectively, when comparing the different treatment groups. Osel = Oseltamivir.