Figures & data
Table 1. List of putative SET-domain KMTs identified in the C. parvum genome.
Figure 1. Schematic representation of putative lysine methyltransferases. The image illustrates SET and non-SET domain organizations in 10 putative KMTs of C. parvum. The additional domains include, associated with SET (AWS), bromodomain, plant homeodomain (PHD), tetratricopeptide repeat (TPR), Myeloid translocation protein 8, Nervy, and DEAF-1 (MYND). The schematic view of different SET domains vary due to the presence of variable region between motif II and motif III.
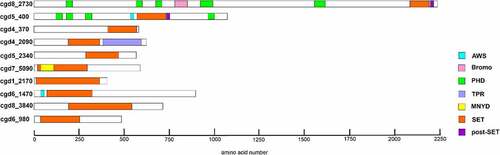
Figure 2. Alignment of SET and post-SET domain sequences of putative CpKmts with representatives of KMT families. The SET domain includes four motifs (I-IV) and their consensus sequences are indicated above the alignment. Motif III and IV are involved in formation of pseudoknot structures to form the active site. The white text on black background indicates identical residues; black text on gray background indicates conserved residues. The residues representing the catalytic site are indicated with phi (Φ). The residues representing F/Y switch are indicated with hash symbol (#). The Cys residue from Motif III that is involved in Zn cluster formation with the post-SET domain are indicated with asterisks (*).
Figure 3. Phylogenetic analysis of SET-domain proteins of C. parvum. The putative Cryptosporidium sequences are highlighted in red. Numbers near the individual nodes indicate bootstrap values given by NJ (left of the slash) and maximum likelihood (right of the slash). Asterisks indicate nodes with bootstrap values below 50%. Branch lengths are proportional to sequence divergence and can be measured relative to the scale bar. The scale bar indicates the branch length corresponding to 0.50 substitutions per site. The substrate specificities of characterized KMTs clustering with the Cp SET domain proteins are indicated on the right (except KMTox and AKMT which refer to representative KMTs in these groups).
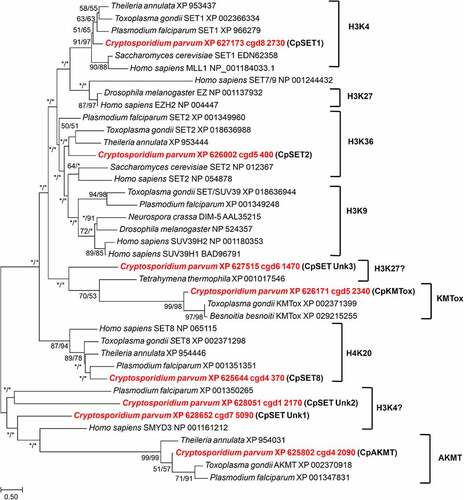
Figure 4. Structural modelling of SET-domain regions of C. parvum KMTs. Superimposition of 3D homology models of SET domains (colored in sandy brown) of CpSET1 (a), CpSET2 (b) and CpSET8 (c), superimposed on the crystal structures of SET domains of Homo sapiens (HsSET1, HsSET2 and HsSET8, respectively) (colored in cyan). The superimposition of the catalytic site is highlighted in the black dotted box and depicted in an enlarged view with side-chains shown in stick representation (nitrogen and oxygen atoms in blue and red, respectively) and labelled in orange and blue for C. parvum and H. sapiens structures, respectively.
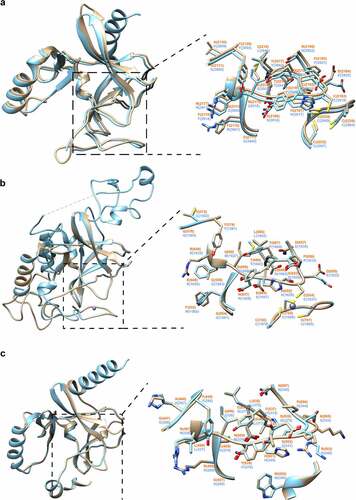
Figure 5. Analysis of recombinant CpSET8 enzymatic activity. (a). Coomassie blue-stained 4–20% precast polyacrylamide gels showing purified CpSET8 showing molecular marker (M), uninduced soluble protein fraction (UN), induced soluble fraction (IN), flow through (FT), washes (W1 and W2), and eluate (E1). (b). Analysis of enzymatic activity showing CpSET8 methylation of H4K20 (anti-H4K20me3 antibody), recombinant human histone H4 (anti-H4 antibody) and recombinant CpSET8 protein (anti-6x-His tag antibody) in the presence of S-adenosyl methionine (SAM).
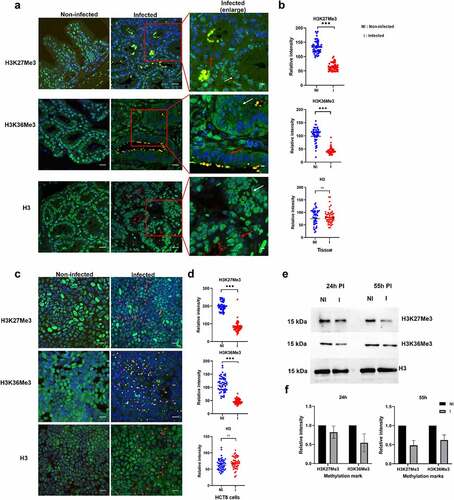
Figure 6. Characterization of KMT gene expression and histone methylation during C. parvum infection in HCT-8 in vitro culture. (a). RT qPCR analysis illustrating expression of CpSET genes during C. parvum development in vitro. The expression levels were analysed in triplicates and normalized with 18S rRNA gene as the internal control. The ΔCt values at the sporozoite stage were used to calibrate. (b). Immunofluorescence analysis of histone lysine modifications in different stages of C. parvum. Co-staining with anti-histone antibodies (H3 and H4) and anti-histone methylation antibodies H3K4me3, H3K36me3 and H4K20me3 (green), anti-Cryptosporidium antibody (red) and DAPI (blue).
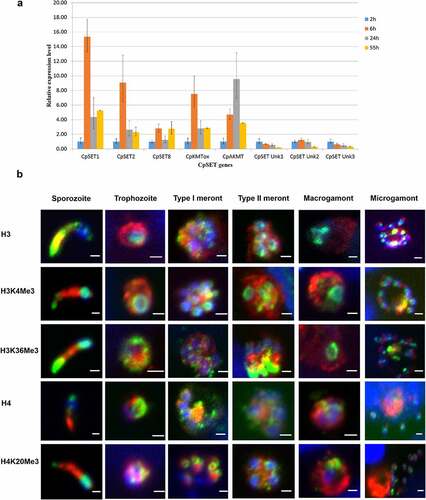
Figure 7. Impact of C. parvum infection on host histone methylation events. (a). Immunofluorescence analysis of histone methylation events during C. parvum infection in vivo at day 60 PI. The red squares represent enlarged images of the infected tissue. Red and white arrows represent infected and uninfected epithelial cells within the intestinal crypt, respectively. Co-staining with antibodies recognizing specific histone methylation (such as H3K36me3, H3K27me3), Histone H3 (green), anti-Cryptosporidium antibody (red) and DAPI (blue) of the ileo-caecal region of C. parvum infected SCID mice. (b). Quantification of fluorescence intensity signals of anti-methylation antibodies in C. parvum infected vs non-infected ileo-cecal tissue. The fluorescence signals were measured for 50 nuclei per sample. For the statistical analysis, a mixed regression model was created considering fluorescence quantification as the main outcome and sample identifier as the random effect. The difference in the fluorescence intensity signals was statistically significant (p<0.05). (c). Immunofluorescence analysis of histone methylation events during C. parvum infection in vitro at 55h PI. (d). Quantification of fluorescence intensity signals of anti-methylation antibodies in C. parvum infected vs non-infected HCT8 cells. The fluorescence signals were measured for 50 nuclei per sample. The difference in the fluorescence intensity signals was statistically significant (p<0.05). (e). Western blotting analysis of histone methylation events during C. parvum infection in vitro at 24 h PI (asexual stage), 55 h PI (sexual stages) after purification of histones from host cell. F) the histograms represent relative intensity signals measured in infected HCT-8 cells with respect to non-infected HCT-8 cells. Each sample was normalized to the H3 used as internal control. The graph represents means in triplicate values for Non-infected HCT8 cells (NI), or infected HCT8 cells (I). Scale bar − 20 µm. Results are representative of three independent experiments.