
Figures & data
Figure 1. SERINC5 represses the expression level of autophagic proteins in CSFV infected cells. (a-d) The protein levels of BECN1, P62, LC3-I/II, ATG5, Npro and GAPDH were tested. PK-15 (a and b) and 3D4/2 (c and d) cells were transfected with 3 × Flag-SERINC5 or siSERINC5, then incubated with CSFV (MOI = 0.1) for 24 and 48 h. The level of proteins was carried out using Image-Pro Plus 6.0 software.
Figure 2. SERINC5 reduces the level of autophagic flux in CSFV infected PK-15 cells. (a and b) PK-15 cells transiently expressing mRFP-GFP-LC3 plasmid were transfected with 3 × Flag-SERINC5 (a) or siSERINC5 (b), and then incubated with CSFV (MOI = 0.1) for 24 h. Confocal fluorescence microscopy was used to capture the yellow dots (autophagosomes), red dots (autophagolysosomes) and blue spots (CSFV-E2 proteins). The GFP/RFP florescence intensity ratio was carried out using Image-Pro Plus 6.0 software. Scale bar: 10 µm.
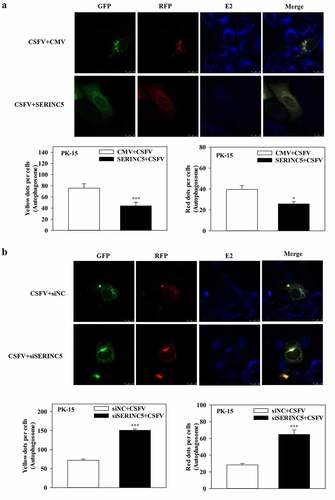
Figure 3. SERINC5 inhibits autophagy by AKT-mTOR and MAPK1/3-mTOR pathways in CSFV infected cells. (a-d) The protein levels of LC3-I/II, p-mTOR, Npro and GAPDH were assayed. PK-15 (a and b) and 3D4/2 (c and d) cells were transfected with 3 × Flag-SERINC5 or siSERINC5, and then were infected or uninfected with CSFV (MOI = 0.1) for 24 h. (e and f) The protein expression of p-mTOR, p-PRKAA, CaMKII, p-AKT, Akt, p-MAPK1/3, MAPK1/3, LC3-I/II, Npro and GAPDH were assayed PK-15 (e) and 3D4/2 (f) cells were transfected with 3 × Flag-SERINC5, and then were infected or uninfected with CSFV (MOI = 0.1) for 24 h. The level of proteins was carried out using Image-Pro Plus 6.0 software.
Figure 4. SERINC5 promotes apoptosis by inhibiting autophagy in CSFV infected cells. (a-d) The protein expression of Cleaved-PARP, Cleaved-Caspase3, Cleaved-Caspase9, Npro and Tubulin were assayed. PK-15 (a and c) and 3D4/2 (b and d) cells were transfected 3 × Flag-SERINC5 or siSERINC5, and then were infected or uninfected with CSFV (MOI = 0.1) for 24 h. The level of proteins was carried out using Image-Pro Plus 6.0 software.
Figure 5. IFITM1/2/3 interacts with SERINC5 and effects CSFV replication. (a) HEK-293T cells were transfected with plasmids encoding Flag-SERINC5 and HA-IFITM1/2/3 protein, the cell lysates were collected and immunoprecipitated (IP) with anti-Flag mAb, and immunoblot (IB) analysis with anti-Flag mAb and anti-HA. (b) the interactions between IFITM1/2/3 and SERINC5 were analysed by Y2H. (c) Colocalization of IFITM1/2/3 and SERINC5. The yellow represents the co-localization of IFITM1/2/3 with SERINC5 protein. Scale bar; 10 µm. PK-15 (d) and 3D4/2 (g) cells were transfected with HA-IFITM1/2/3, and then were incubated with CSFV (MOI = 0.1) for 24 and 48 h. The protein levels of Npro and GAPDH were assayed. PK-15 (e, f) and 3D4/2 (h, i) cells were transfected with siNC or IFITM1/2/3 siRNA for 24 h. The siRNA silencing efficiency of IFITM1/2/3 were carried out using Western blotting (e, h) and qRT-PCR (f, i). The protein levels of Npro and GAPDH were assayed. The level of proteins was carried out using Image-Pro Plus 6.0 software.
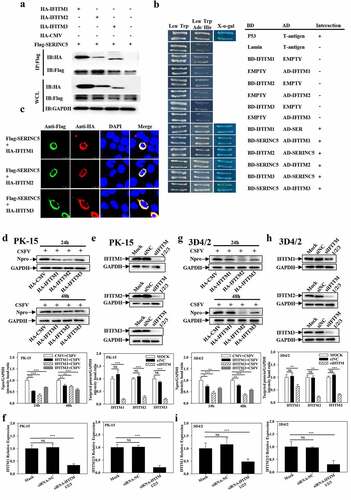
Figure 6. Overexpression of IFITM1/2/3 regulates the expression level of autophagic proteins in CSFV infected PK-15 and 3D4/2 cells. (a and b) The preotein levels of BECN1, P62, LC3-I/II, ATG5, Npro and GAPDH were assayed. PK-15 (a) and 3D4/2 (b) cells were transfected with HA-IFITM1/2/3 or siIFITM1/2/3, followed by incubated with CSFV (MOI = 0.1) for 24 and 48 h. The level of proteins was carried out using Image-Pro Plus 6.0 software.
Figure 7. Overexpression of IFITM1/2/3 changes the expression level of autophagic proteins in Rapa treated PK-15 and 3D4/2 cells. (a and b) The protein levels of BECN1, P62, LC3-I/II, ATG5 and GAPDH were assayed. PK-15 (a) and 3D4/2 (b) cells were respectively pretreated with 100 nmol Rapa or equal amount of DMSO for 1 h, followed by transfected with HA-IFITM1/2/3 or siRNA of siIFITM1/2/3 for 24 h. The level of proteins was carried out using Image-Pro Plus 6.0 software.
Figure 8. IFITM1/2/3 alter the level of autophagic flux in CSFV infected PK-15 cells. (a and b) PK-15 cells transiently expressing mRFP-GFP-LC3 plasmid were transfected with HA-IFITM1/2/3 (a) or siIFITM1/2/3 (b), and then incubated with CSFV (MOI = 0.1) for 24 h. Confocal fluorescence microscopy was used to capture the yellow dots (autophagosomes), red dots (autophagolysosomes) and blue spots (CSFV-E2 proteins). The GFP/RFP florescence intensity ratio were analysed using Image-Pro Plus 6.0 software. Scale bar: 10 µm.
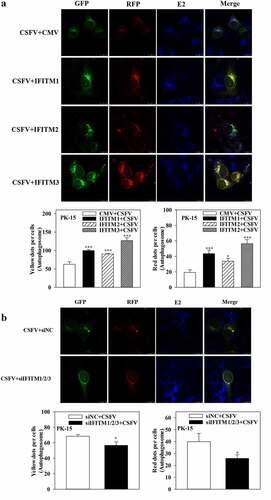
Figure 9. IFITM1/2/3 regulates autophagy in a LAMP1 protein dependent manner. (a and b) The protein levels of LAMP1, Npro and GAPDH were assayed. PK-15 (a) and 3D4/2 (b) cells were transfected with HA-IFITM1/2/3, and then were infected or uninfected with CSFV (MOI = 0.1) for 24 h. PK-15 (c) and 3D4/2 (d) cells were transfected with HA-IFITM1/2/3 and siLAMP1 for 24 h, followed by incubated with CSFV (MOI = 0.1) for another 24 h. The protein levels of LC3-I/II, LAMP1, Npro and GAPDH were assayed. The level of proteins was carried out using Image-Pro Plus 6.0 software.
Figure 10. Pharmacological regulation of autophagic changes the regulation of IFITM1/2/3 on the NF-κB pathway. (a and b) Luciferase activities were tested by DLR..HEK-293T cells were transfected with HA-IFITM1/2/3 and pRL-TK (a) or siIFITM1/2/3 and pRL-TK (b) together with the NF-κB or IFNβ luciferase reporter for 24 h, followed by incubated with Sev for another 24 h. pRL-TK was used as an internal control. PK-15 (c) and 3D4/2 (d) cells were transfected with siIFITM1/2/3, and then were infected or uninfected with CSFV (MOI = 0.1) for 24 h. The protein expression of P65, IκB, p-IκB, IκB-Ras, Npro and Tubulin were assayed by Western blotting analysis. (e-g) The expression levels of P65, IκB, p-IκB, IκB-Ras, Npro and Tubulin were carried out using Western blotting. PK-15 (e and f) and 3D4/2 (f and h) cells were respectively pretreated with 100 nmol Rapa or 5 mM 3-MA or equal amount of DMSO for 1 h, and then transfected with siIFITM1/2/3 for 24 h, followed by incubated with CSFV (MOI = 0.1) for another 24 h. The level of proteins was carried out using Image-Pro Plus 6.0 software.
Figure 11. Interference of IFITM1/2/3 enhances the inhibitory effect of SERINC5 on autophagy pathway. (a and b) The protein levels of SERINC5, HA-IFITM1/2/3 and GAPDH were carried out using Western blotting. PK-15 (a) and 3D4/2 (b) cells were co-transfected with HA-IFITM1/2/3 and Flag-SERINC5 (0, 100, 200, 500 ng) for 24 h. (c and d) The transcription level of IFITM1/2/3 were analyzed by RT-qPCR. PK-15 (c) and 3D4/2 (d) cells were transfected with Flag-SERINC5, and then were infected or uninfected with CSFV (MOI = 0.1) for 24 h. (e-h) The protein levels of BECN1, P62, LC3-I/II, ATG5, Npro and GAPDH were assayed. PK-15 (e) and 3D4/2 (g) cells were transfected with siIFITM1/2/3 and 3 × Flag-SERINC5 for 24 h, followed by incubated with CSFV (MOI = 0.1) for another 24 h. PK-15 (f) and 3D4/2 (h) cells were respectively pretreated with 100 nmol Rapa, and then transfected with siIFITM1/2/3 for 24 h. The level of proteins was carried out using Image-Pro Plus 6.0 software.
Supplemental Material
Download PDF (7.8 MB)Data availability statement
All data that support the findings of this study are available from the corresponding author upon reasonable request.