
Figures & data
Figure 1. Intracellular survival rates of the MKR superspreader and H37Rv inside host macrophages.(a-b) THP-1 cells were infected with mCherry-expressing MKR superspreader or H37Rv for 1 hr. Cells were washed to eliminate the uninternalized mycobacteria. At 0, 24, and 48 hr after infection, cells were fixed and processed for high-content image analysis to determine intracellular mycobacterial number per cell. Percent mycobacterial survival was calculated and then compared (a). Representative images are shown in (b). Data are means ± SEM from at least three independent experiments; ns, non-significant, ***p < 0.001 and ****p < 0.0001, all relative to the 0 hr control set to 100%, were determined by one-way ANOVA with Tukey’s multiple comparison test. Bar 20 μm.
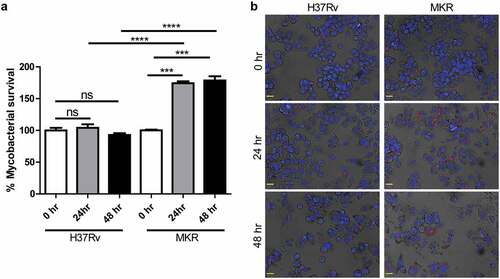
Figure 2. Principle component analysis. Samples from the same experimental conditions appear to cluster together in accordance with their gene expression profiles. The first principal component (PC1) captures the gene expression profile differences across the 2 time points post-infection (0 and 4 hr post-infection), while the second principal component (PC2) captures the gene expression profile differences among H37Rv- and MKR-infected macrophages. TB0_H37RV, macrophages infected with H37Rv at 0 hr post-infection; TB4_H37RV, macrophages infected with H37Rv at 4 hr post-infection; TB0_MKR, macrophages infected with MKR at 0 hr post-infection; TB4_MKR, macrophages infected with MKR at 4 hr post-infection.
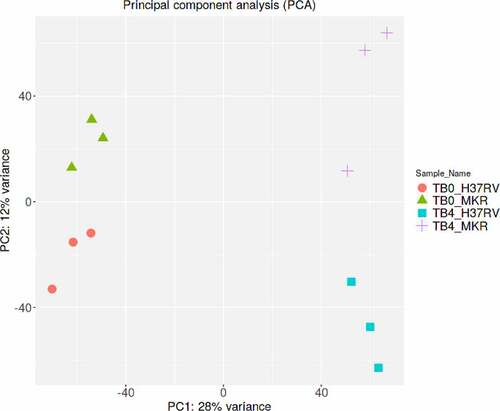
Figure 3. Differential gene expression analyses. (a-b) Volcano plots were used to determine the significantly different expressed transcripts among biological conditions (experimental group versus baseline): H4 vs H0 (a) and M4 vs M0 (b). Only log2(fold change) ≥ 2 or ≤ 2 and false discovery rate (FDR) adjusted p-values < 0.05 were analyzed. The upregulated transcripts were labelled in red and downregulated transcripts were labelled in blue. H0, macrophages infected with H37Rv at 0 hr post-infection; H4, macrophages infected with H37Rv at 4 hr post-infection; M0, macrophages infected with MKR at 0 hr post-infection; M4, macrophages infected with MKR at 4 hr post-infection.
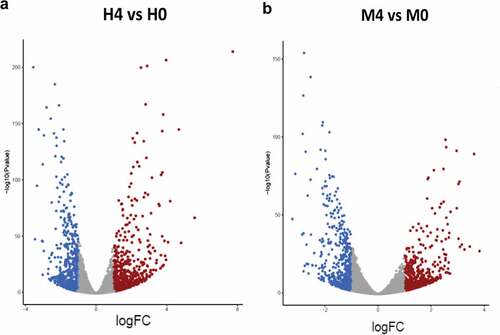
Figure 4. Validation of twelve DEGs in the MKR-infected macrophages by qRT-PCR. (a-l) THP-1 macrophages were infected with H37Rv or MKR at MOI 10 for 1hr and samples were analyzed at either 0 hr or 4 hr post-infection. Total RNAs were isolated and cDNAs were synthesized. The expression levels of twelve genes shown to be differentially expressed by the RNA-Seq data were quantified by qRT-PCR. 2−∆∆ct was used for normalization and relative quantification. Data are the means ± SEM from three independent experiments; ns, non-significant, *p < 0.05, **p < 0.01,***p < 0.001 and ****p < 0.0001, all relative to the respective 0 hr control set to 1.0 were determined by one-way ANOVA with Tukey’s multiple comparison test. M0, macrophages infected with MKR at 0 hr post-infection; M4, macrophages infected with MKR at 4 hr post-infection; M01, M02, M03 correspond to three biological repeats of macrophages infected with MKR at 0 hr post-infection; M41, M42, M43 correspond to three biological repeats of macrophages infected with MKR at 4 hr post-infection; FPKM, fragments per kilobase of transcript per million mapped reads.
Figure 5. Functional enrichment analysis of the upregulated DEGs in the H37Rv- and MKR-infected macrophages was performed using Metascape.(a) Bar graph showing the top 20 enriched ontology clusters of the H37Rv-infected macrophages. (b) Bar graph showing the top 20 enriched ontology clusters of the MKR-infected macrophages. The enriched ontology clusters were ranked by -log10 p-value of gene enrichment.
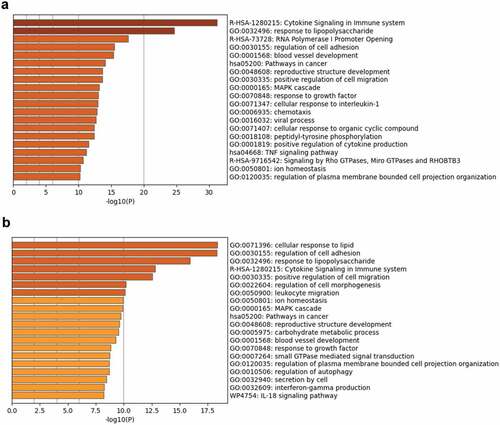
Figure 6. DEGs of the MKR-infected macrophages that function in the cellular response to the lipid pathway were subjected to network analysis using GeneMANIA. The network interactions identified included the fatty acid transport, lipid transport, and response to molecule of bacterial origin, as well as response to lipopolysaccharide, positive regulation of cell-cell adhesion, fatty acid transmembrane transport, and the fatty acid metabolic process.
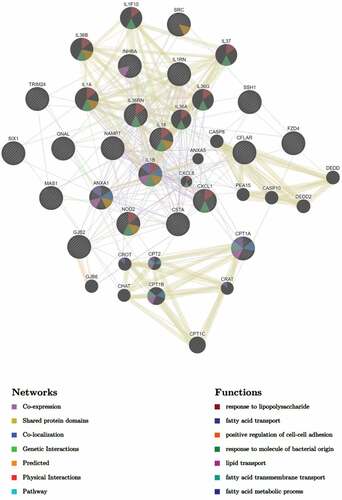
Figure 7. IL-36RN/IL-36G expression ratio is increased in the MKR-infected macrophages when compared to those infected with H37Rv. (a-b) THP-1 macrophages were infected with H37Rv or MKR at MOI 10 for 1 hr and samples were analyzed at either 0 hr or 4 hr post-infection. The expression levels of IL-36RN(a) or IL-36G (b) transcripts were determined by RNA-Seq and presented as mapped reads. Data are means ± SEM from three independent experiments; ns, non-significant, *p < 0.05 and **p < 0.01, relative to the respective 0 hr control set of 1.0 were determined by one-way ANOVA with Tukey’s multiple comparison test. (c-d) The expressions of IL-36RN(c) or IL-36G (d) were then confirmed by qRT-PCR. 2−∆∆ct was used for normalization and relative quantification. Data are means ± SEM from at least three independent experiments; ns, non-significant and ****p < 0.0001, relative to the respective 0 hr control set of 1.0 were determined by one-way ANOVA with Tukey’s multiple comparison test. (e)The IL-36RN/IL-36G expression ratio of H37Rv- or MKR-infected macrophages was determined by dividing the respective normalized RNA-Seq mapped reads. *p < 0.05, relative to the H37Rv control set to 1.0 was determined by Student’s t-test. H0, macrophages infected with H37Rv at 0 hr post-infection; H4, macrophages infected with H37Rv at 4 hr post-infection; M0, macrophages infected with MKR at 0 hr post-infection; M4, macrophages infected with MKR at 4 hr post-infection.
Figure 8. IL-36RN is crucial for the intracellular viability of MKR. (a)THP-1 cells were transfected with the non-targeted scrambled control (Scb) or IL-36RN-targeted siRNAs. The IL-36RN expression levels were then determined by qRT-PCR at 48 hr post-transfection. Data are means ± SEM from three independent experiments; ***p < 0.001, relative to Scb control set to 1.0 was determined by Student’s t-test. (b-c) siRNA-transfected THP-1 cells were infected with mCherry-expressing H37Rv or MKR for 1 hr and washed with complete media to get rid of the uninternalized mycobacteria. Cells were then further incubated in the complete media for 24 hr and subsequently processed for high-content image analysis to determine the intracellular mycobacterial number per cell. Percent mycobacterial survival was calculated and then compared (b). Representative images are shown in (c). Data are means ± SEM from at least three independent experiments; ns, non-significant, *p<0.05 and ***p < 0.001, all relative to the respective 0 hr control set to 100%, were determined by one-way ANOVA with Tukey’s multiple comparison test. Bar 20 μm.
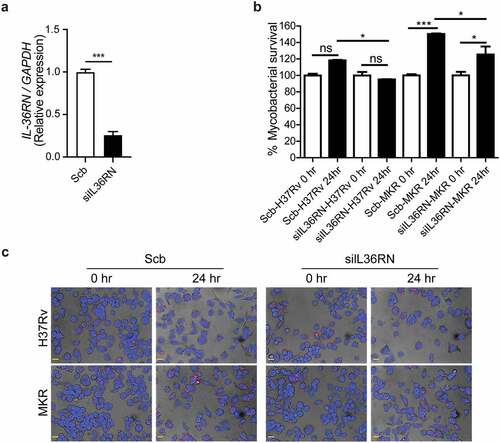
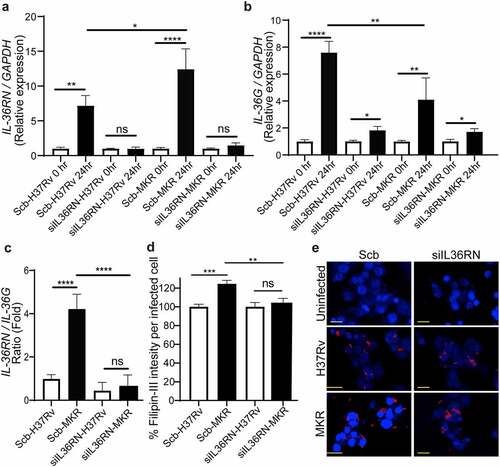
Figure 9. IL-36RN/IL-36G expression ratio is increased in the scrambled siRNA-transfected MKR-infected macrophages when compared to those infected with H37Rv and IL-36RN is important for the increased cholesterol level in host macrophages by the MKR. (a-b) THP-1 cells were transfected with the non-targeted scrambled control (Scb) or IL-36RN-targeted siRNAs. At 48 hr post transfection, cells were infected with H37Rv or MKR at MOI 10 for 1 hr and samples were analyzed at either 0 hr or 24 hr post-infection. The expression levels of IL-36RN(a) or IL-36G (b) transcripts were determined byqRT-PCR. 2−∆∆ct was used for normalization and relative quantification. Data are means ± SEM from at least three independent experiments; ns, non-significant, *p < 0.05, **p < 0.01 and ****p < 0.0001, relative to the respective 0 hr control set of 1.0 were determined by one-way ANOVA with Dunnett’s multiple comparison test. (c)The IL-36RN/IL-36G expression ratio of H37Rv- or MKR-infected macrophages transfected with scrambled control or IL-36RN-targeted siRNAs were determined by dividing the respective normalized relative expression at 24 hr post-infection from (a-b). ns, non-significant and ****p < 0.0001, relative to the scrambled siRNA-transfected H37Rv-infected control cells set to 1.0 were determined by one-way ANOVA with Tukey’s multiple comparison test. (d-e) THP-1 cells were transfected with the non-targeted scrambled control (Scb) or IL-36RN-targeted siRNAs. At 48 hr post transfection, cells were infected with mCherry-expressing H37Rv or MKR at MOI=10 for 1 hr and washed with complete media to get rid of the uninternalized mycobacteria. Cells were then further incubated in the complete media for 24 hr and subsequently processed for high-content image analysis to determine the intracellular cholesterol levels by Filipin-III staining. Percent Filipin-III intensity per infected cell were calculated and then compared (d). Representative images are shown in (e). Data are means ± SEM from at least three independent experiments; ns, non-significant, **p<0.01 and ***p < 0.001, all relative to the respective H37Rv-infected cells set to 100%, were determined by one-way ANOVA with Bonferroni’s multiple comparison test. Bar 20 μm.
Supplemental Material
Download PDF (795 KB)Data availability statement
The RNA-Seq data have been uploaded to the Gene Expression Omnibus (GEO) database (Accession number GSE194017).