
Figures & data
Table 1. Primers used for amplifying the genes encoding BVDV proteins.
Table 2. Primers used for qRT-qPCR.
Figure 1. Activation of the NF-κB signalling pathway induced by BVDV. A: Detection of BVDV-infected BT cells by IFA; B: Detection of UV-inactivated BVDV-infected BT cells by IFA, using live BVDV as control; C: The NF-κB relative dual-luciferase activity in BVDV-infected BT cells determined at 12 h, 24 h, and 48 h after BVDV infection, using mock- and UV-inactivated BVDV-infected cells as control; D: Detection of the p65 nuclear translocation at 12 h, 24 h, and 48 h after BVDV infection by Western blotting; E: Determination of relationship between NF-κB relative dual-luciferase activity and viral dose; F: Detection of relationship between the p65 nuclear translocation and viral dose; G: Detection of BVDV-induced p65 nuclear translocation by IFA. Data are given as means ± SD values. The lowercase letters (a vs. b; b vs. c; c vs. d) indicate significant difference of P <0.05; a vs. c and b vs. d indicates significant difference of P <0.01; a vs. d indicates significant difference of P <0.001.
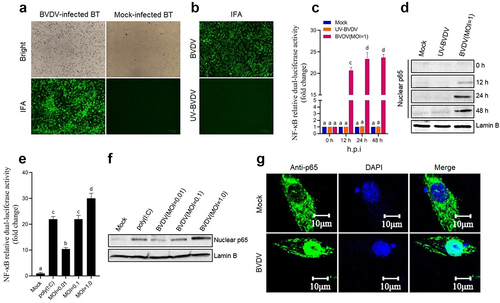
Figure 2. Expression levels of the genes encoding cytokines (IL-6, IL-8, pro-IL-1β, TNF-α, COX-2, and NOS-3) and NLRP3 inflammasome (NLRP3, pro-caspase 1, and ASC) determined by qRT-PCR. Total RNA of BT cells from mock group, BVDV group, BVDV+DMSO group, BVDV+BAY 11–7082 (NF-κB inhibitor) group, and BVDV+QNZ (NF-κB inhibitor) group was extracted and reverse transcribed into cDNA respectively, followed by qRT-PCR detection. Results indicated that BVDV infection-induced inflammatory response was regulated by the activation of NF-κB signalling pathway. Data are given as means ± SD values. *, P <0.05; **, P <0.01; ***, P <0.001.
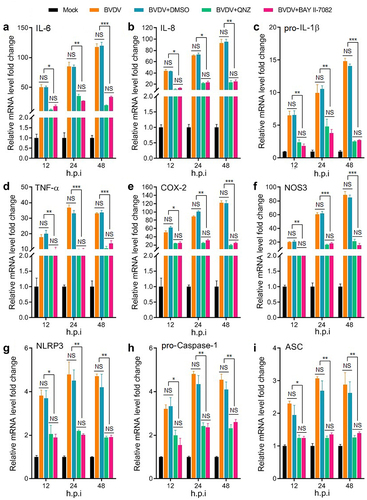
Figure 3. Identification of BVDV infection-induced NLRP3 inflammasome activation and the cleavage of pro-caspase 1 and pro-IL-1β by Western blotting, using β-actin as an internal reference.
Figure 4. Expression and identification of BVDV proteins in BT cells and 293T cells transfected with recombinant eukaryotic plasmids expressing viral proteins by IFA and Western blotting (A). Viral proteins-induced NF-κB relative dual-luciferase activities in BT cells (B) and 293T cells (C) were detected after transfection, showing that the Erns and NS5A proteins mainly contributed to the activation of the NF-κB signalling pathway in a dose-dependent manner in BT cells (D). The expression levels of the genes encoding NLRP3, pro-caspase-1, ASC, and pro-IL-1β were determined in transfected bovine cells with the Erns-expressing plasmid and the NS5A-expressing plasmid (E), showing a dose-dependent manner. Data are given as means ± SD values. *, P <0.05; **, P <0.01; ***, P <0.001.
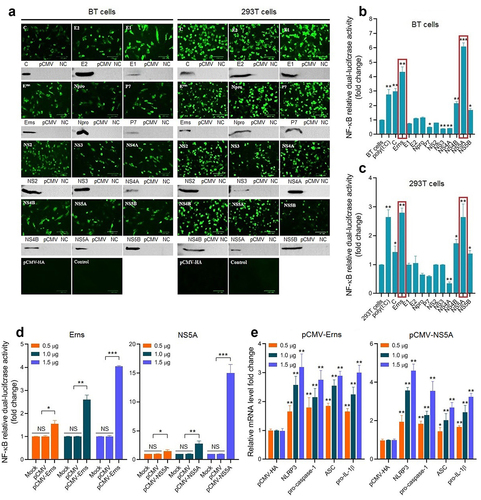
Figure 5. The IκBα degradation and the p65 phosphorylation in the cytoplasm and p65 nuclear translocation were detected in the transfected bovine cells with the Erns-expressing plasmid (A) and the NS5A-expressing plasmid (B) by Western blotting. C: The p65 nuclear translocation induced by the Erns and NS5A proteins was detected by IFA. The lowercase letters (a vs. b; b vs. c; c vs. d) indicate significant difference of P <0.05; a vs. c indicates significant difference of P <0.01; a vs. d indicates significant difference of P <0.001.
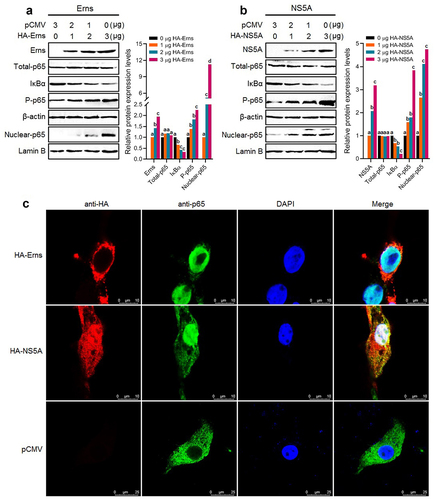
Figure 6. The prediction result of functional domains of the Erns protein (A) and NS5A protein (C) and amplification of the gene fragments encoding truncated Erns protein (B) and truncated NS5A protein (D). E: Expression and identification of truncated proteins in the transfected BT cells by IFA. F and G: The NF-κB relative dual-luciferase activities in the transfected BT cells with recombinant eukaryotic plasmids expressing truncated proteins. Data are given as means ± SD values. The lowercase letters (a vs. b; b vs. c) indicate significant difference of P <0.05; a vs. c indicates significant difference of P <0.01.
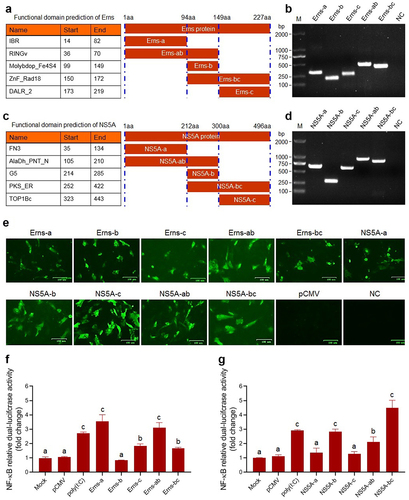
Figure 7. Identification results of the NF-κB pathway activation induced by the PKS_ER functional domain of the NS5A protein. Expression of PKS_ER functional domain in the transfected BT cells and 293T cells identified by IFA (A) and Western blotting (B). C: PKS_ER functional domain-induced NF-κB relative dual-luciferase activities detected in the transfected BT cells and 293T cells. D: PKS_ER functional domain-induced activation of the NF-κB pathway in the transfected bovine cells identified by Western blotting. E: The expression levels of the genes encoding NLRP3, pro-caspase-1, ASC, and pro-IL-1β were determined in the transfected bovine cells, showing a dose-dependent manner. F: Detection of the cholesterol levels in BVDV-infected bovine cells, NS5A-expressing bovine cells, and PKS_ER-expressing bovine cells, using normal bovine cells and pCMV-transfected bovine cells as the negative control. G: Identification of cholesterol-induced p65 phosphorylation and p65 nuclear translocation by Western blotting. H: Identification of cholesterol-induced p65 nuclear translocation by IFA. Data are given as means ± SD values. *, P <0.05; **, P <0.01; ***, P <0.001. The lowercase letters (a vs. b; b vs. c; c vs. d) indicate significant difference of P <0.05; a vs. c indicates significant difference of P <0.01; a vs. d indicates significant difference of P <0.001.
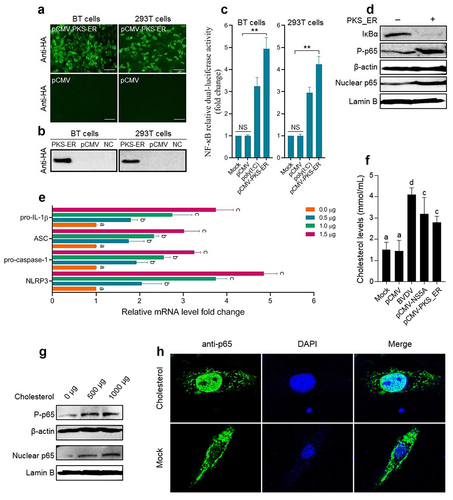
Figure 8. Analysis of the amino acid homology of the NS5A protein from BVDV strain AV69 and BVDV strain Nose.
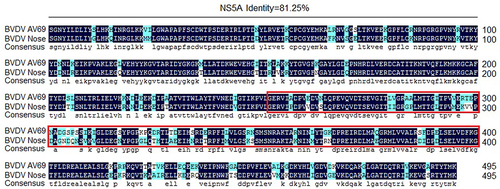
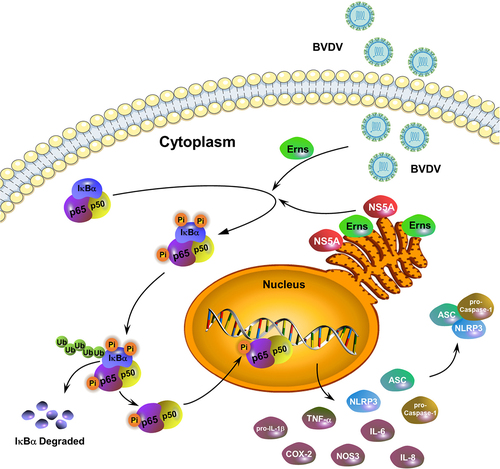
Figure 9. A schematic diagram of BVDV infection-induced inflammatory responses via the activation of the NF-κB pathway.
Data availability statement
The authors confirm that the data supporting the findings of this study are available within the article.