
Figures & data
Figure 1. The interaction between NDV F protein and AP complexes following transfection or infection. For A and C, BSR-T7/5 cells were co-transfected with expression plasmids for an F protein (wildtype, Y524A, Y527A, or YY245 + 527AA) and an AP complex (AP1M1, AP2M1, AP3M1, AP4M1, or AP5M1). (a) at 36 h post-transfection, the cells were fixed, and their nuclei were stained with DAPI. The level of co-localization was observed via laser scanning confocal microscopy. (b) Quantification of the co-localization of F protein and AP under YLMY-motif mutation was performed by calculating the Pearson’s correlation coefficient using ImageJ. (c) Cell lysates were immunoprecipitated (IP) with anti-Flag antibody. The immunoprecipitates and whole-cell lysates (WCL) were analysed by western blotting with anti-Flag, anti-Myc, and anti-Tubulin. (d) BSR-T7/5 cells were infected with NDV containing a wildtype (rSG10*) or mutant (rSG10*-F/Y524A, rSG10*-F/Y527A, or rSG10*-F/Y524AY527A) YLMY motif. At 36 hpi, lysates of these cells were incubated overnight at 4 °C with anti-AP1M1 or anti-AP2M1 pre-conjugated Protein A/G magnetic beads, after which immunoprecipitation was conducted.
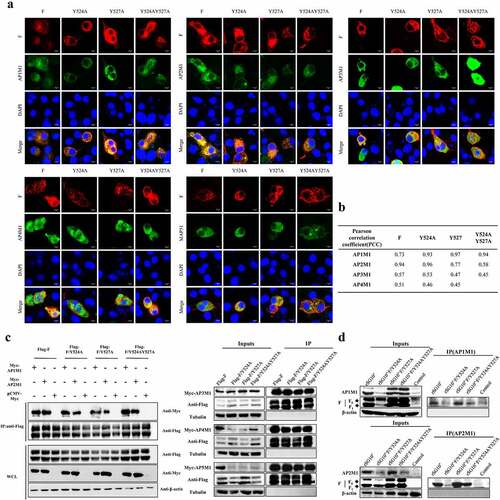
Figure 2. AP1M1 and AP2M1 are required for NDV infection. (a) the effects of different siRNA in the transfected cells were analysed by RT-qPCR. (b) the viability of siRNA-transfected cells. (c) Expression of the NP (top) and F (bottom) genes following infection of AP1M1-knockdown cells with an NDV containing a wildtype (rSG10*) or mutant (rSG10*-F/Y524A, rSG10*-F/Y527A, or rSG10*-F/Y524AY527A) YLMY motif, as measured by qPCR. (d) Expression of AP1M1 in NDV-infected control (siControl-transfected) or AP1M1-knockdown (siAP1M1-transfected) cells. (e) Expression of the NP (top) and F (bottom) genes following infection of AP2M1-knockdown cells with an NDV containing a wildtype (rSG10*) or mutant (rSG10*-F/Y524A, rSG10*-F/Y527A, or rSG10*-F/Y524AY527A) YLMY motif, as measured by qPCR. (f) Expression of AP2M1 in NDV-infected control (siControl-transfected) or AP2M1-knockdown (siAP2M1-transfected) cells. Results shown in panels A – F represent data pooled from at least two independent experiments. The values presented are the mean ± SD. *p <0.05; **p <0.01; ***p <0.001.
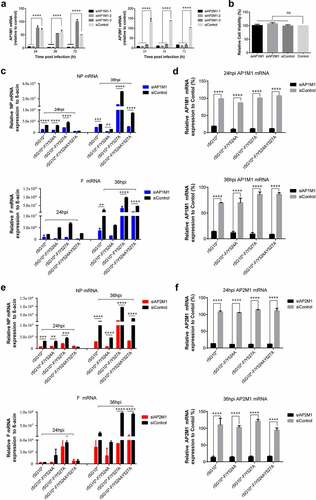
Figure 3. The YLMY motif does not regulate the mRNA expression of AP complexes. (a) the mRNA expression levels of AP1M1 and AP2M1 in control BSR-T7/5 cells at various time points (24, 28, 32, or 36 hpi), as analysed by RT-qPCR. (b–d) the mRNA level of F protein (b), AP1M1 protein (c), or AP2M1 protein (d) in cells infected with an NDV containing a wildtype (rSG10*) or mutant (rSG10*-F/Y524A, rSG10*-F/Y527A, or rSG10*-F/Y524AY527A) YLMY motif. Results in panels a–d represent data pooled from at least two independent experiments. The values presented are the mean ± SD. *p <0.05; **p <0.01; ***p <0.001.
Figure 4. The YLMY motif regulates the protein expression of AP complexes. BSR-T7/5 cells were infected with an NDV containing a wildtype (rSG10*) or mutant (rSG10*-F/Y524A, rSG10*-F/Y527A, or rSG10*-F/Y524AY527A) YLMY motif, at a multiplicity of infection of 0.1. (a) the expression levels of each F protein and host AP1M1 and AP2M1 at various post-infection time points were determined by western blotting. (b) Protein expression levels are expressed as percentages of the levels for rSG10*, which were set at 100%. The p-values were calculated by a two-way ANOVA; *p < 0.05; **p <0.01; ***p <0.001; n = 3.
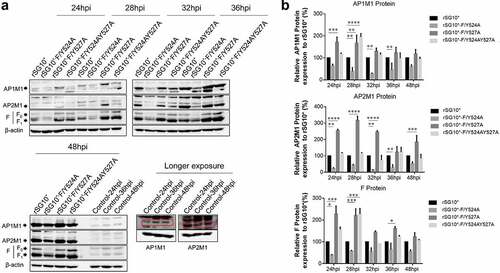
Figure 5. The viral F protein is transported by AP-1 and AP-2. (a) Expression of AP1M1 and AP2M1 in the membrane protein fraction was determined by western blot. BSR-T7/5 cells were infected with an NDV containing a wildtype (rSG10*) or mutant (rSG10*-F/Y524A, rSG10*-F/Y527A, or rSG10*-F/Y524AY527A) YLMY motif, at a multiplicity of infection of 0.1. The membrane protein was extracted, following the kit instructions, at different post-infection time points. (b) Quantitative analysis of AP1M1, AP2M1, and viral F protein expression levels, expressed as percentages of the levels for rSG10* (set at 100%). (c) a co-IP conducted on the membrane proteins. After cells were infected with an NDV containing a wildtype or mutant YLMY motif, the membrane protein fraction was extracted and used in an immunoprecipitation performed with an anti-F antibody. (d) TEM micrographs of infected cells at 36 hpi. White arrows mark the presence of many lysosomes and autophagosomes, and black arrows indicate transport vesicles in the cytoplasm. N, nucleus; ER, endoplasmic reticulum.
Figure 6. Treatment with siAP1M1 or siAP2M1 impairs the expression and transportation of mutant F protein. (a) at 24 h after cells were transfected with siAP1M1 or siAP2M1, they were infected with an NDV containing a wildtype (rSG10*) or mutant (rSG10*-F/Y524A, rSG10*-F/Y527A, or rSG10*-F/Y524AY527A) YLMY motif. The F protein expression level in these cells was measured by western blot. (b) the proteins of cells treated as above were separated into membrane and cytoplasm fractions before being subjected to a western blot. (c) Quantitative analysis of the viral F protein expression from part (b). Protein expression levels are presented as percentages of the β-actin expression level. The p-values were calculated by a two-way ANOVA; *p <0.05; **p <0.01; ***p <0.001; n = 3.
Figure 7. AP regulates the intracellular and supernatant viral titres of NDVs with a mutated YLMY motif. The viral infectivity was measured as the tissue culture infective dose by inoculating naive cells with lysates (intracellular virus) or supernatants (extracellular virus) from NDV-infected cells in which AP1M1 or AP2M1 had been depleted via siRNA treatment. (a–d) the intracellular (a and b) or extracellular (c and d) virus titer of siAP1M1-treated (a and c) or siAP2M1-treated (b and d) cells infected with an NDV containing a wildtype (rSG10*) or mutated (rSG10*-F/Y524A, rSG10*-F/Y527A, or rSG10*-F/Y524AY527A) YLMY motif.
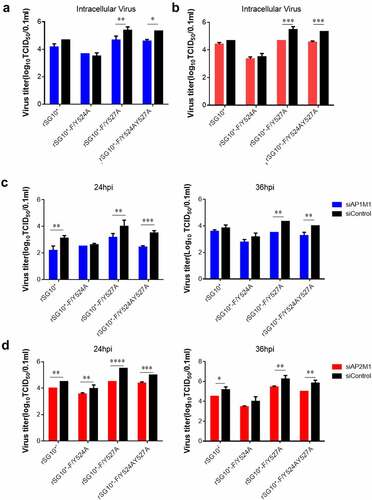
Figure 8. The expression of p-AP2M1, AAK1, and GAK in cells infected with an NDV containing a wildtype or mutated YLMY motif. Cells were infected with an NDV containing a wildtype (rSG10*) or mutated (rSG10*-F/Y524A, rSG10*-F/Y527A, or rSG10*-F/Y524AY527A) YLMY motif. (a) the phosphorylation of AP2M1 in these cells was detected by western blot. (b) the mRNA expression levels of viral NP and F genes and host AAK1 and GAK genes in these cells were analysed by RT-qPCR. The p-values were calculated by a two-way ANOVA; *p <0.05; **p <0.01; ***p <0.001; n = 3. (c) Protein expression of host AAK1 and GAK in these cells.
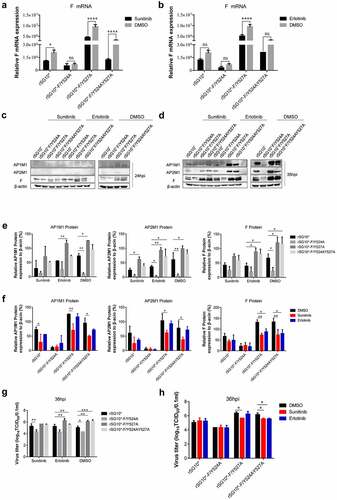
Figure 9. The influence of inhibitors sunitinib and erlotinib on NDV F, AP1M1, and AP2M1 protein expression. (a and b) Viral F mRNA expression of cells infected with an NDV containing a wildtype (rSG10*) or mutated (rSG10*-F/Y524A, rSG10*-F/Y527A, or rSG10*-F/Y524AY527A) YLMY motif and treated with sunitinib (a) or erlotinib (b). The cells were infected with NDV at 37 ℃ for 1 h, and then the cells were treated with 1 µm sunitinib or 10 µm erlotinib; DMSO was used as a negative control. The p-values were calculated by a two-way ANOVA; *p <0.05; **p <0.01; ***p <0.001; n = 3. (c and d) the F, AP1M1, and AP2M1 protein expression at 24 hpi (c) or 36 hpi (d) in cells infected with an NDV containing a wildtype (rSG10*) or mutated (rSG10*-F/Y524A, rSG10*-F/Y527A, or rSG10*-F/Y524AY527A) YLMY motif and treated with sunitinib or erlotinib. (e) Quantitative analysis of the viral F and host AP1M1 and AP2M1 protein expression by treatment group (sunitinib, erlotinib, or DMSO). (f) Quantitative analysis of the viral F and host AP1M1 and AP2M1 protein expression by NDV strain (rSG10*, rSG10*-F/Y524A, rSG10*-F/Y527A, or rSG10*-F/Y524AY527A). (g) Virus titre of each treatment group (sunitinib, erlotinib, or DMSO). The virus titer was measured as the tissue culture infective dose by inoculating naive cells with supernatants from infected cells. (h) Virus titer of each NDV strain (rSG10*, rSG10*-F/Y524A, rSG10*-F/Y527A, or rSG10*-F/Y524AY527A). The p-values were calculated by a two-way ANOVA; *p <0.05; **p <0.01; ***p <0.001; n = 3.
Supplemental Material
Download TIFF Image (574.9 KB)Data availability statement
The authors confirm that the data supporting the findings of this study are available within the article.