Figures & data
Figure 1. In vitro and in vivo analysis of biological characteristics of rescued viruses. (a) Schematic diagram of H1N1 PA-X-deficient viruses. The red letters represent nucleotides at the mutation sites. (b) PA-X, NP, and β-actin expression was measured using western blotting assay (MOI of 10 at 12 h p. i.). (c-d) Growth curves of rPR8 and rPR8-△PAX viruses in DF-1 (c) and Calu-3 (d) cells with an infection dose of 0.01 MOI at 72 h. p. i. Analysis was based on unpaired two-sided student’s t-test. (e-l) Six-week-old SPF BALB/c mice were infected with rPR8 and rPR8-△PAX (101-106 EID50/50 μL doses). Body weights and survival were recorded in rPR8-infected (f, h) and rPR8-△PAX-infected (g, i) mice over a 14-d period (n = 5). (j) Virus replication in lungs (n = 3). (k) H&E staining of lung sections (n = 3). Scale bar = 100 μm. (l) Histopathological scores of lungs on 5 d. p. i. (n = 3). Data are presented as mean ± SD. One-way ANOVA was used to measure statistical significance. *P <0.05, **P <0.01. MOI, multiplicity of infection; SPF, specific-pathogen-free; h. p. i., hours post infection; d. p. i., days post infection; ANOVA, analysis of variance.
Figure 2. Determining the ability of viruses to infect DCs. (a, b) NP expression on DCs was detected at 6, 48, and 72 h. p. i. (MOI of 0.5). (c-f) When the infection dose was 107 EID50 in 50 μL PBS, the infectivity of DCs in murine CLNs was detected by FACS. (c) G1 represents CCR7+ CD11c+ DCs in living cells. (d) FACS statistic of (c), the proportion of CCR7+ CD11c+ DCs. (e) is from G1 for analysing the level of NP protein. (f) FACS statistic of (e) based on the MFI. Data are presented as mean ± SD. One-way ANOVA was used to measure statistical significance. *P <0.05, **P <0.01. DCs, dendritic cells; MOI, multiplicity of infection; h. p. i, hours post infection; PBS, phosphate buffered saline; CLNs, cervical lymph nodes; FACS, flow cytometry; MFI, mean fluorescence intensity; ANOVA, analysis of variance.
Figure 3. In vivo recruitment of DCs into the nasal mucosa. (a-e) Once infection reached 107 EID50 in 50 μL PBS in mice, the number of DCs recruited to the nasal mucosa was measured. (a-b) Recruitment of DCs into the nasal mucosa was measured using FACS at 3 h. p. i.. (a) G1 represents CD11c+ DCs from living cells. (b) G2 or G3 from G1 represent CD11b+CD11c+or CD103+ CD11c+ DCs, respectively. (c-e) FACS statistic of (a) and (b), the proportion of CD11c+ DCs (c), CD11b+CD11c+ DCs (d), and CD103+CD11c+ DCs (e). (f-h) Confocal microscopic examination of murine nasal mucosa following intranasal infection. Quantification of CCL20 (g) or CD11b+ CD11c+ (h) positive cells in nasal epithelial cells (n= 3). Nuclei (blue), CCL20 (pink), CD11c (red), CD11b (green). Scale bar=10 μm. (i, j) Transcriptional levels of CCL20 in Calu-3 cells measured at 6 (i) and 24 (j) h. p. i. when the MOI was 0.01. Data are presented as mean ± SD. One-way ANOVA was used to measure statistical significance. *P < 0.05, **P < 0.01. DCs, dendritic cells; FACS, flow cytometry; h. p. i., hours post infection; MOI, multiplicity of infection; ANOVA, analysis of variance.
Figure 4. In vitro and in vivo analysis of the ability of DCs to migrate to CLNs. DCs were infected with rPR8 or rPR8-△PAX (MOI = 0.5) in vitro. (a, b) FACS analysis of CCR7 expression in the samples collected at 24 h. p. i. (c, d) CCL19, a chemokine secreted from draining lymph nodes, was added to the lower chamber and the infected DCs were added to the upper chamber. The number of migrating DCs was then counted. (e-h) Six-week-old SPF C57BL/6 mice were intranasally infected with rPR8 or rPR8-△PAX viruses (107 EID50 in 50 μL PBS), the DCs in murine CLNs was detected by FACS at 6 h. p. i. (e) G1 represents CCR7+ CD11c+ DCs from living cells. (f) FACS statistic of (e), the percent of CCR7+ CD11c+ DCs. (g) is from G1 for analysing the MFI levels of MHC II and CD40 on the CCR7+ CD11c+ DCs. (h) FACS statistic of (g). Data are presented as mean ± SD. One-way ANOVA was used to measure statistical significance. *P <0.05, **P <0.01. h. p. i., hours post infection; DCs, dendritic cells; CLNs, cervical lymph nodes; SPF, specific-pathogen-free; PBS, phosphate buffered saline; FACS, flow cytometry; MOI, multiplicity of infection; ANOVA, analysis of variance; MFI, mean fluorescence intensity.
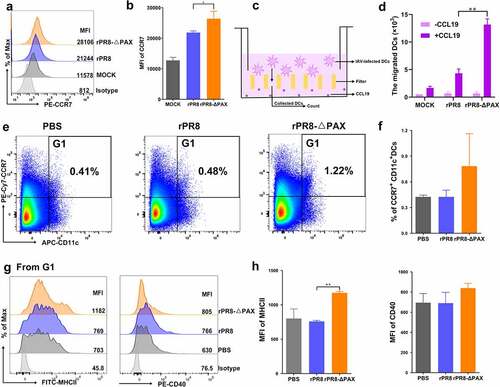
Figure 5. The morphological changes, endocytosis, and phenotypic maturation of DCs following infection in vitro. DCs were infected with rPR8 or rPR8-△PAX at a dose of 0.5 MOI. (a) the morphological characteristic of DCs were analysed at 24 h. p. i., with LPS as a positive control. Scale bar = 20 μm. (b) the results of the cellular shape indices (major axis/minor axis) (n = 30, 30 DCs were randomly selected from 5 separate experiments, 6 cells from each experiment). (c, d) Endocytosis by DCs was detected at 24 h. p. i. using FACS, with LPS as a positive control. (e, f) the MFI of phenotypic markers on DCs was measured using FACS at 24 h. p. i.. Data are presented as mean ± SD from one of three independent experiments. One-way ANOVA was used to measure statistical significance. *P <0.05, **P <0.01. DCs, dendritic cells; MOI, multiplicity of infection; h. p. i., hours post infection; LPS, lipopolysaccharide; FACS, flow cytometry; MFI, mean fluorescence intensity.
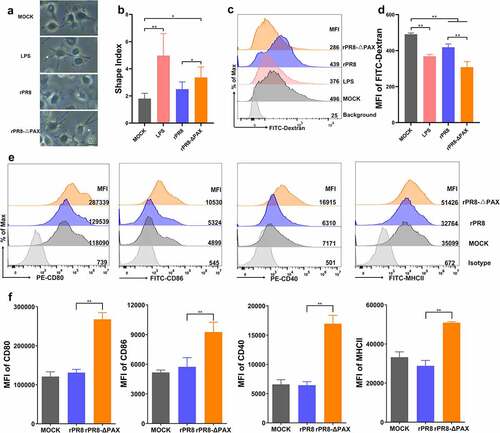
Figure 6. Cytokine responses in DCs. (a, b) CD69 expression was detected using FACS once the MOI reached 0.5 in vitro. (c) DC supernatants were collected at 24 h. p. i., and then the levels of secreted cytokines (IL-1β, IL-6, TNF-α, and IL-10) were measured using the ELISA kits. Data are presented as mean ± SD from one of three independent experiments. One-way ANOVA was used to measure statistical significance. *P <0.05, **P <0.01. DCs, dendritic cells; FACS, flow cytometry; MOI, multiplicity of infection; h. p. i., hours post infection.
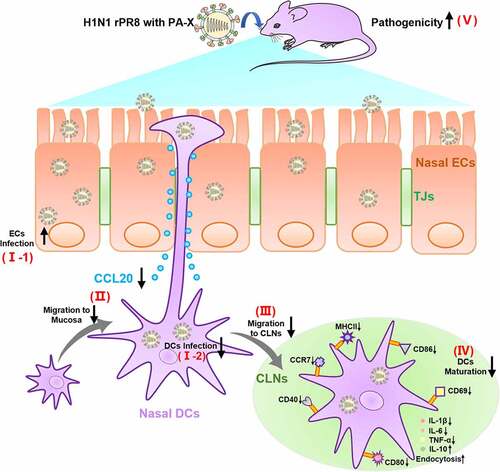
Figure 7. PA-X protein of H1N1 influenza virus inhibited the immune functions of nasal mucosal DCs for increasing virulence. PA-X enhanced H1N1 influenza virus to infect ECs (I-1) but reduced the ability to infect DCs (I-2). (II) CCL20, a chemokine that monitors the recruitment of DCs to the submucosa, was downregulated by PA-X, resulting in an inhibition of the DC recruitment. (III) PA-X attenuated the migration of CCR7+ DCs to CLNs for suppression of downstream immune responses. (Ⅳ) PA-X impaired the maturation of DCs in the CLNs by downregulating the phenotypic markers and the levels of secreted pro-inflammatory cytokines while enhancing endocytosis and anti-inflammatory IL-10 levels. (Ⅴ) Based on above immune escape mechanism, the pathogenicity of H1N1 rPR8 strain was finally enhanced in mice. TJs, tight junctions; CLNs, cervical lymph nodes; DCs, dendritic cells; ECs, epithelial cells.