Figures & data
Figure 1. Flow chart describing the study search and selection process.
Table 1. List of the included studies.
Figure 2. Humoral immune responses across all included studies.
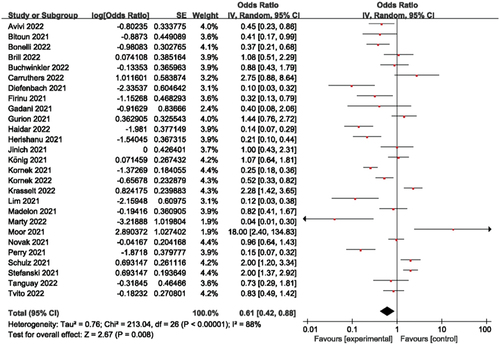
Figure 3. Humoral immune responses according to prespecified subgroups of 3-6, 6, 6–9 and 9–12 months since the last dose of anti- CD20 therapy.
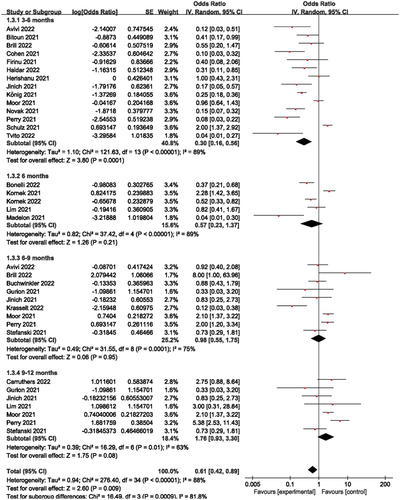
Figure 4. ROC curve on the time interval of SARS-CoV-2 vaccination in 1455 patients treated with anti-CD20.The vertical coordinates indicate that all patients who actually received the vaccine were greater than 5.5 months from the last dose of anti-CD20 monoclonal antibody therapy were not infected with the COVID-19. The abscissa indicates that all patients who actually received the vaccine were more than 5.5 months from the last dose of anti-CD20 monoclonal antibody therapy were infected with the COVID-19.
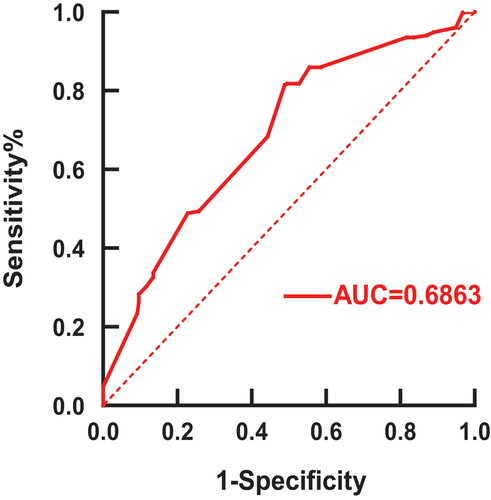
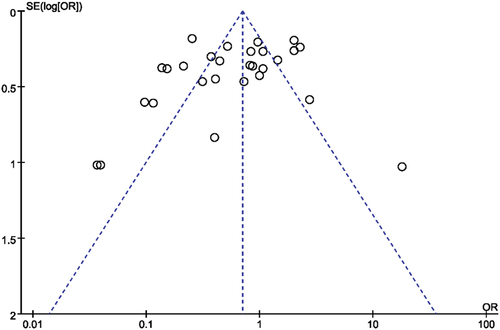
Figure 5. Funnel plot of all included studies.