Figures & data
Table 1. Virulence factors detected in the 234 E. coli blood isolates.
Figure 1. MST based on virulence allelic profiles of the 234 E. coli blood isolates. The analysis was carried out in Bionumerics. Nodes are colour-coded per ST. In brackets next to the ST is the number of strains with that ST. Branch length is directly proportional to the allelic difference.
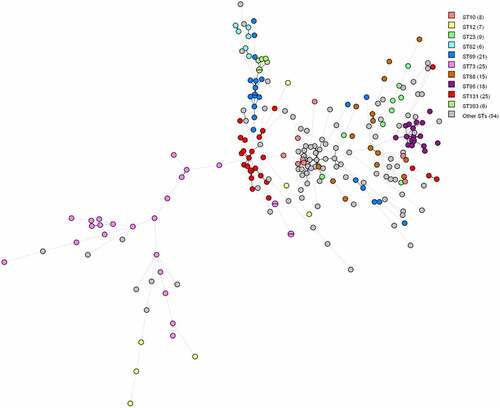
Figure 2. MST based on cgMLST analysis of 234 E. coli blood isolates. The analysis was carried out in Bionumerics. Nodes are coloured per pathotype. In brackets next to the pathotype is the number of strains belonging to that pathotype. Branch length is directly proportional to the allelic difference.
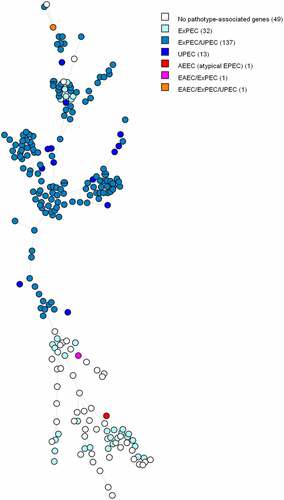
Figure 3. MST of STs using the Achtman seven-gene MLST scheme for 234 E. coli blood isolates. The analysis was carried out in Bionumerics. The tree is coloured based on the infection type of the isolates (green: community-acquired, red: healthcare-acquired). Thirty-five nodes are colored red and 93 nodes are colored green. Branch length and width (dotted versus non-dotted) are directly proportional to the allelic difference (ranging from one for the shortest branches to seven for the longest branches).
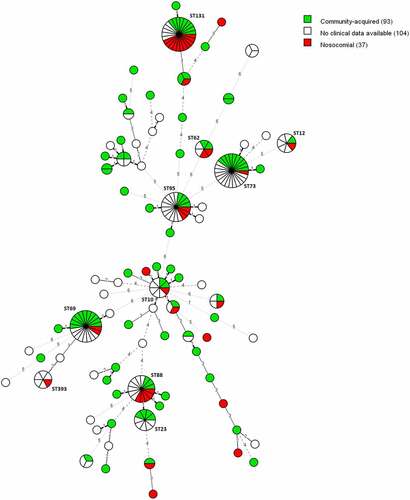
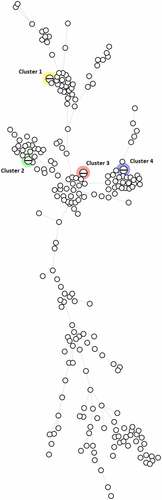
Figure 4. MST based on cgMLST analysis of 234 E. coli blood isolates. The analysis was carried out in Bionumerics. A fixed threshold of < 5 allelic differences was used for clustering isolates, highlighting four different clusters. Branch length is directly proportional to the allelic difference.