
Figures & data
Figure 1. Screening of candidate eukaryotic-like proteins in L.P. strain Corby identifies Smh1 as a candidate histone-deacetylase. (a) Pipeline of analyses from the in silico annotation of protein sequences of L.P. strain Corby to the identification of candidate proteins from their eukaryotic-like protein domains, screened for enzymatic functions suggesting potential impact on the host regulatory machinery. (b) a total of 2,385 proteins were annotated with protein domains from Pfam database. Relative representation of annotated protein domain across the different kingdoms of life highlights a subset of 202 proteins bearing domains mostly represented in eukaryotic sequences. (c) Representation across kingdoms of the Pfam domain PF00850 “histone-deacetylase,” annotated in the sequence of the candidate protein ABQ55614 from L.P. strain Corby. (d) Results of the BLASTP search for homologous proteins to ABQ55614 in L.P. subspecies as well as Salmonella species. Percentage of sequence identity are reported for best hits; “n.S.h:” no significant hit. (e) Clustal omega multiple sequence alignment of the orthologs of ABQ55614 identified in L.P. subspecies. Blue colouring indicates conservation levels, while red frames indicate the independent predictions of the histone-deacetylase domains in each protein sequence. (f) Jalview visualization of the clustal omega alignment of histone-deacetylase domains extracted from L.P. proteins from strains Corby and Philadelphia, as well as from the Human Histone-deacetylase 3 (HDAC3, NCBI protein ID NP_003874) and the protein “XP_004368317” from A. castellanii. Amino acids are coloured to highlight physicochemical properties (Zappo colour scheme). Yellow barplots identify levels of conservation.
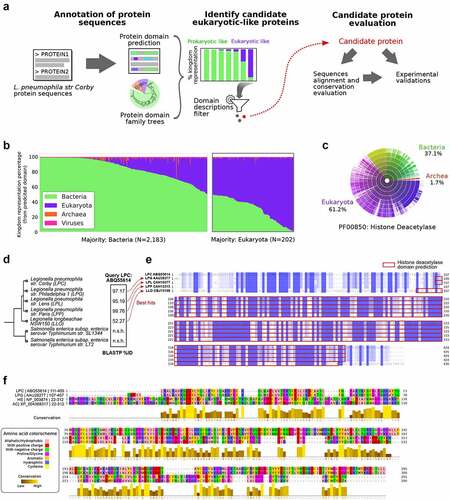
Figure 2. Effector protein Smh1 translocates into host cytosol and influences gene expression and Legionella pneumophila replication. (a) RAW 264.7 cells expressing cytosolic LgBit were infected with L.P. (T4SS-capable as well as the T4SS-incapable ΔdotA mutant) expressing HiBit-tagged Smh1 at MOI 50. Luminescence was detected over a period of 20 h. Two-way ANOVA with Sidak´s correction was performed and data are shown as mean ± SEM of at least three independent biological replicates. ****p ≤ 0.0001 for comparison between background genotypes. (b) Overexpression of Smh1 in LpC was verified by qPCR. (C-F) THP-1 cells expressing Smh1 (THP-1Smh1) and corresponding control cells (THP-1Ctrl) were stimulated with PMA (80 nM) for 72 h and infected with L. pneumophila Corby (LpC) at MOI 1 for 3 h (C-E) or 24 h (F) or left uninfected. (c) Venn representation shows significantly (padj <0.05) regulated genes after expression of Smh1 alone or additional LpC infection in comparison to infected Ctrl. Expression data for every section is provided in Table S1. (d) the four genes from the central Venn overlap are shown with their z-scores computed on normalized read counts from DeSeq2. (e) IL-1β expression was examined by qPCR and is shown as fold change of the uninfected Ctrl. (f) IL1β release was measured by ELISA. (g) PMA-differentiated THP-1 cells were infected with LpC at MOI 10. Bacterial replication was analysed by colony forming unit (CFU) Assay 2 and 24 hours post infection (h p.I.). (E-G) Two-way ANOVA with Sidak´s correction was performed and data are shown as mean + SEM of at least three independent biological replicates. *p ≤ 0.05; **p ≤ 0.01 (compared to infected Ctrl).
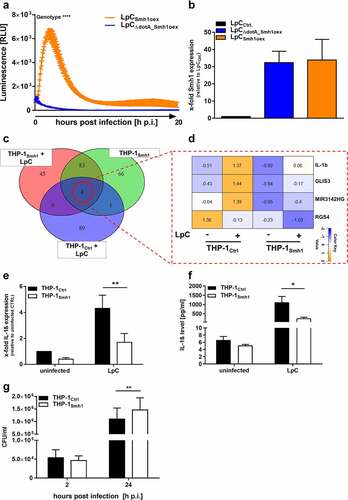
Figure 3. Expression of Smh1 in THP-1 cells leads to loss of induction of key pro-inflammatory genes. (A) Logic distribution of significantly (padj <0.05) upregulated genes in the indicated conditions in comparison to infected control (THP-1Ctrl + LpC). Data on acetylated genes after LpC infection were taken from Du Bois et al. 2016 (*) [Citation17]. Expression data for every section is provided in Table S2. (B) the 21 transcripts that fail to be regulated significantly in THP-1Smh1 cells are shown with their z-scores computed on normalized read counts from DeSeq2. (C) Ingenuity Pathway Analysis (IPA) revealed the interaction of 11 among the 21 proteins found to be acetylated after LpC infection which are also upregulated on transcript level in infected control cells but not in infected THP-1Smh1 cells. IPA filters were set to include only experimentally observed or high-confidence predicted interaction partners. Interaction types between nodes are provided in Table S3. Node aesthetics are from StringDB.
![Figure 3. Expression of Smh1 in THP-1 cells leads to loss of induction of key pro-inflammatory genes. (A) Logic distribution of significantly (padj <0.05) upregulated genes in the indicated conditions in comparison to infected control (THP-1Ctrl + LpC). Data on acetylated genes after LpC infection were taken from Du Bois et al. 2016 (*) [Citation17]. Expression data for every section is provided in Table S2. (B) the 21 transcripts that fail to be regulated significantly in THP-1Smh1 cells are shown with their z-scores computed on normalized read counts from DeSeq2. (C) Ingenuity Pathway Analysis (IPA) revealed the interaction of 11 among the 21 proteins found to be acetylated after LpC infection which are also upregulated on transcript level in infected control cells but not in infected THP-1Smh1 cells. IPA filters were set to include only experimentally observed or high-confidence predicted interaction partners. Interaction types between nodes are provided in Table S3. Node aesthetics are from StringDB.](/cms/asset/7b0852c1-a140-446d-8086-c31c90e827a6/kvir_a_2149973_f0003_oc.jpg)
Figure 4. Smh1 is a histone-deacetylase and is active in the nucleus of the host cell where it targets histone 3 and 4. (a) THP-1Smh1 cells were stimulated with PMA (80 nM) for 72 h. Afterwards, the cytoplasmic and nucleic fractions were separated. Western Blot was performed against the Smh1-fused HA-tag. Lamin a was used as housekeeper for the nuclear fraction and α1c Tubulin for the cytosolic fraction. One representative blot of 3 is shown. The relative quantification of Smh1 is normalized to the cytosolic fraction. A paired t-test was performed. Data are shown as mean + SEM of three independent biological replicates. *p ≤ 0.05. THP-1Smh1 and corresponding control cells (THP-1Ctrl) were stimulated with PMA (80 nM) for 72 h. Function of Smh1 as a histone-deacetylase was confirmed by examination of histone 3 and 4 acetylation (H3ac and H4ac) by Western Blot (b and c). One representative blot of three independent biological replicates is shown. Relative quantification of H3ac and H4ac in comparison to actin is normalized to Ctrl. Unpaired t-test was performed, and data are shown as mean + SEM of three independent biological replicates. *p ≤ 0.05; **p ≤ 0.01.
Figure 5. Knockdown of Smh1 in LpC only affects intracellular growth. (a) Growth of LpC with a CRISPRi – mediated Smh1 knockdown (LpCkd_smh1) was measured at a wavelength of 600 nm and a temperature of 37°C for 18 h. For comparison, LpC with a control vector (LpCCtrl) were used. Data are shown as mean ± SEM of at least three independent biological replicates. (b + c) THP-1 cells were stimulated with PMA (80 nM) for 72 h. Afterwards, cells were infected with LpCkd_smh1 and LpCCtrl at MOI 1 for 24 h. (B) Smh1 knockdown was verified before from bacterial input material and 24 h post infection (h p.I.). One-way ANOVA was performed and data are shown as mean + SEM of at least three independent biological replicates. *p ≤ 0.05; ***p ≤ 0.001. (C) Bacterial replication was analysed by colony forming unit (CFU) assay 24 hours post infection (h p.I.). Paired t-test was performed and data are shown as mean + SEM of at least three independent biological replicates.
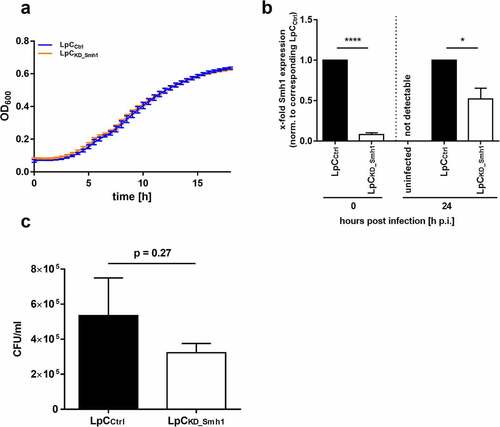
Figure 6. Targeted mutation of Smh1 leads to reduced HDAC function (a) the amino acid sequence alignment of HDAC8 (1st row) and Smh1 (2nd row) is shown. The bar chart under the sequences represents the conservation in both enzymes, 10 representing maximal conservation. The overall enzyme identity is 12.78%. The red arrows indicate the respective catalytic tyrosine in HDAC8 and Smh1. (b) Structure prediction of Smh1 with signal peptide. The colour represents the confidence of the model; the colour key is given under the structure model. Except for the N- and C-termini, the confidence-value is higher than 90% which represents a model with a high accuracy. (c) Superposition of the catalytic core of both enzymes. In blue is shown the enzyme form human and in green the one of L. pneumophila with the respective catalytic tyrosine. The reddish dot represents the zinc ion that is necessary for the catalytic mechanism. (d) a chemical HDAC activity assay specific for class I and II HDACs was performed with recombinant purified Smh1 as well as a Smh1 mutant (Smh1mut) expressed in E. coli. HeLa Nuclear Extract (NE) was used as positive control and buffer without Smh1 as negative control. For inhibition of Smh1, the enzyme was incubated for 30 minutes with 50 µm Trichostatin a (TSA). One-way ANOVA was performed, and data are shown as mean + SEM of three experiments. **** p ≤ 0.0001 (compared to Smh1 without TSA); ## p ≤ 0.01; #### p ≤ 0.0001 (compared to the respective condition without TSA). (e) Calf thymus histones were treated with recombinant purified Smh1 or a mutated version (Smh1mut). Subsequently mass spectrometry was performed. Relative abundances (percentages) were calculated for H3K18 and H3K14 acetylation (H3K18ac and H3K14ac). Untreated histones were used as control.
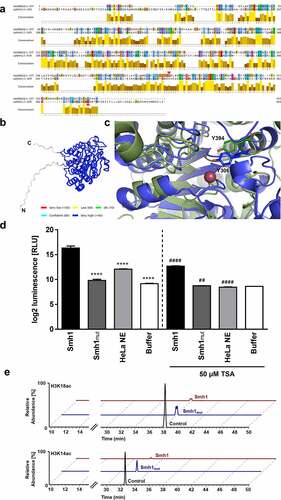
Table 1. qPCR primers.
Table 2. Antibodies.
Supplemental Material
Download Zip (3.3 MB)Data availability statement
The data that support the findings of this study are openly available in NCBI Geo at https://www.ncbi.nlm.nih.gov/geo, reference number GSE185936.