Figures & data
Figure 1. Systemic model of APEC infection. (a) Model I was designed to evaluate the effects of infection at different time points. (b) Chickens showed obvious fever after infection (magnification of 100×). (c) The blood samples coated on the MacConkey plates at different time points. (d) The sections from liver tissue stained with haematoxylin and eosin. (e-h) The complete blood cell count for blood sample at different time points.
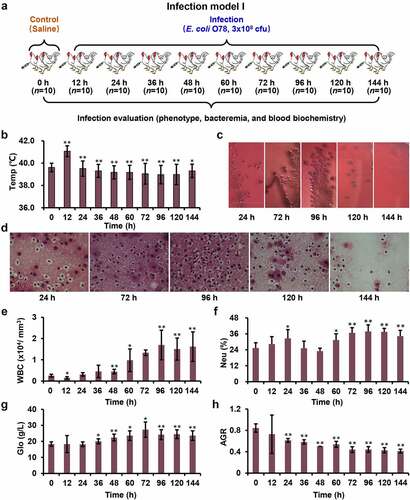
Figure 2. Flowchart of the spleen-based proteomic study. Infection model II was carried out to obtain the samples at 12 h, 36 h, 72 h and 144 h for quantitative proteome by TMT 10-plex labeling.
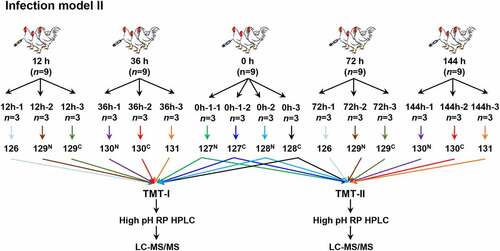
Figure 3. Dysregulated proteins of chicken spleens after E. coli infection. (a) The identified and quantified proteins from quantitative proteomics. (b). Venn diagram of protein groups identified from TMT-I and TMT-II. The heat map of dysregulated proteins from the (c) TMT-I (0 h/12 h/36 h) and (d) TMT-II (0 h/72 h/144 h). (e) The cluster proteins with persistent dysregulation at different time points after infection. (f) The volcano plot of dysregulated proteins between 12 h and 0 h, 36 h and 0 h, 72 h and 0 h, and 144 h and 0 h (log2 fold change >3×SD, p-value <0.05).
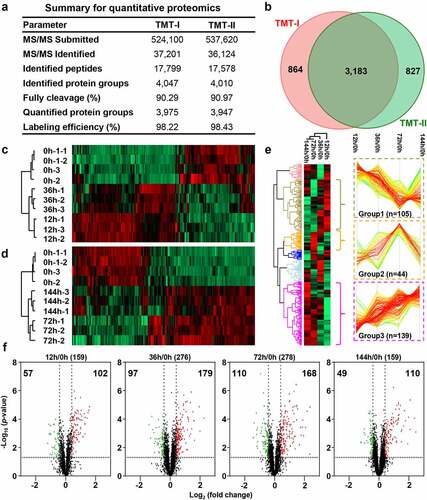
Figure 4. Dysregulated genes of chicken spleens at mRNA level after E. coli infection. (a) Overlap of identified genes between proteome and transcriptome analysis. (b) The Gaussian fitting curve of log2 ratio of the FPKM of technical replicates a1–1 and a1–2. (c) The PCA analysis between the control and infected chickens. (d) The volcano plot of 1,442 up-regulated genes and 1,001 down-regulated genes (log2 fold change >5xSD, p-value <0.05). (e) The heat map comparison of dysregulated genes between the control and infected chickens.
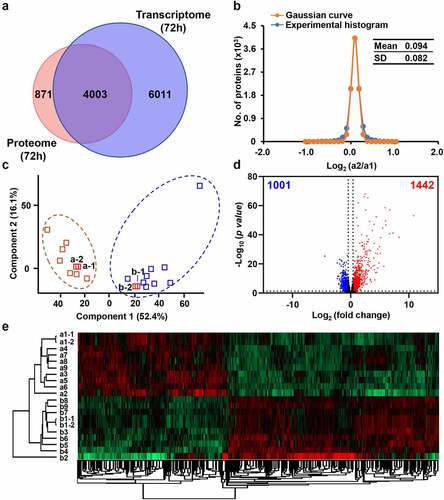
Figure 5. KEGG pathway analysis. (a) KEGG pathway analysis of the dysregulated DEPs from quantitative proteomics. (b) KEGG pathway analysis of the dysregulated DEGs from transcriptomic. The red and blue represent up-regulated and down-regulated genes, respectively. The asterisk represents pathways in which both dysregulated DEPs and DEGs are enriched.
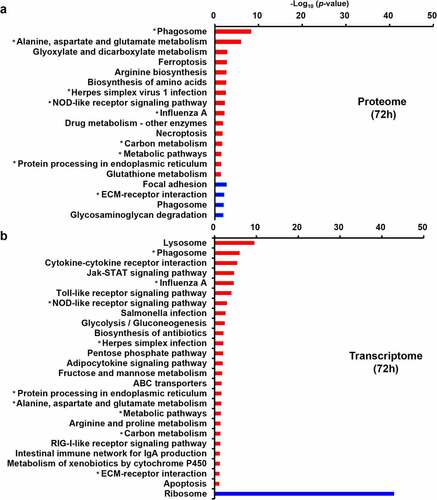
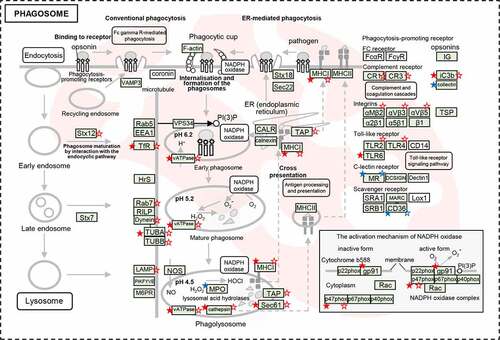
Figure 6. The dysregulated DEPs and DEGs were significantly enriched in the pathway of phagosome maturation. Schematic model for phagosome maturation after E. coli infection. The significantly dysregulated genes at protein level and mRNA level were marked by stars (solid stars: protein level dysregulation, hollow stars: mRNA level dysregulation, red: up-regulation, blue: down-regulation).