
Figures & data
Table 1. Primers used in this study and their target genes.
Table 2. Minimum inhibitory concentration (MIC) and minimum fungicidal concentration (MFC) of antifungal drugs against P. brasiliensis yeasts from several strains.
Figure 1. Micafungin differently influences the growth pattern of yeasts from various P. brasiliensis strains. Concentration highlighted in red represents the Minimum Inhibitory Concentration (MIC). wt-PCN: P. brasiliensis wild-type strain; ov-PCN: PCN-overregulated strain; kd-PCN: PCN-downregulated strain; and EV: empty vector. Ctrl+: Growth control, yeast free from drug effects. 63X objective. Bars, 50 µm.
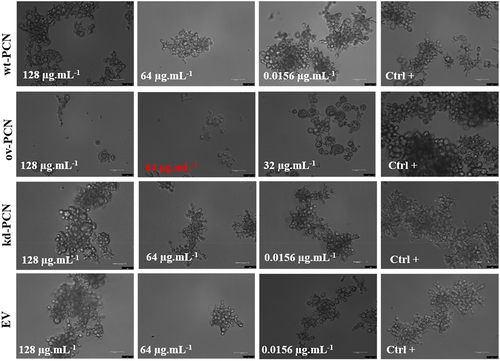
Figure 2. Susceptibility of yeasts from various P. brasiliensis strains to cellular stress-inducing agents. The following P. brasiliensis strains were assayed: wt-PCN yeasts; ov-PCN yeasts; kd-PCN yeasts; and EV: empty vector. Ctrl+: control of yeasts grown on BHI agar containing 100 µg/ml ampicillin. The plates were incubated at 37 °C for 7–10 days for colony formation. The colonies were visually examined.
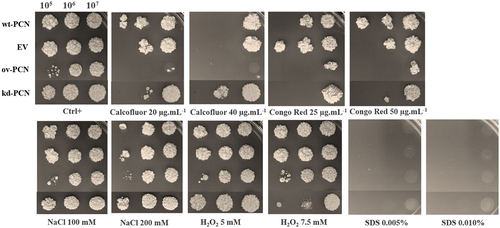
Table 3. Minimum inhibitory concentration (MIC) of cellular stress-inducing agents to inhibit growth of P. brasiliensis yeasts from several strains.
Figure 3. PCN effect on the virulence of P. brasiliensis as verified in G. mellonella experimental fungal infection. Each G. mellonella larva was infected with 5 x 10⁶ yeasts of wt-PCN, ov-PCN, kd-PCN, or EV (empty vector) (n = 24). Larvae inoculated with PBS were used as negative controls. (a) Survival curves of infected G. mellonella larvae with P. brasiliensis yeasts from different strains; p values represent the log-rank test in wild-type strain vs. transformed yeasts. (b) CFU recovering 48 h after infection of G. mellonella larvae with P. brasiliensis yeasts from different strains. *** p < 0.0001 vs. ov-PCN-infected group; ## p < 0.001 vs. kd-PCN infected group. (c) Hemocyte density, determined by counting cells in a Neubauer hemocytometer of the hemolymph samples, collected 48 hours after infection with P. brasiliensis yeasts from different strains; asterisks indicate statistical significance (*** p < 0.0001) relative to the PBS group.
Figure 4. PCN effect on the virulence of P. brasiliensis according to histological findings in infected G. mellonella larvae. Forty-eight hours after being infected with yeasts from P. brasiliensis strains, wt-PCN (b), ov-PCN (c), kd-PCN (d), and EV (e), G. mellonella larvae sections were PAS-stained and microscopically examined. Control corresponds to uninfected larvae inoculated with phosphate-buffered saline (PBS) instead of yeasts (a). 20X amplification (a-e). Enlarged images (f-j). Bars indicate 1 mm at A, C, and D; 2 mm in B and E; and 200 µm of F-J. Black arrows indicate P. brasiliensis yeast aggregates; a, cuticle; b, adipose bodies; c, granuloma-like structure; d, fungal cells.
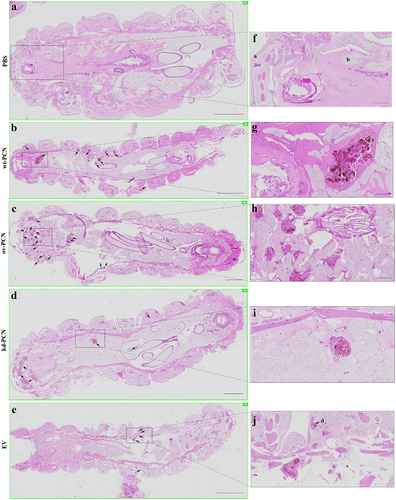
Figure 5. PCN effect on the P. brasiliensis susceptibility to amphotericin B (AmB) as verified in G. mellonella experimental fungal infection. (a) Survival curves of G. mellonella larvae infected with 5 x 10⁶ yeasts from P. brasiliensis different strains and treated at 1 h post-infection with amphotericin B 0.5 mg/kg; p values represent the log-rank test in wild-type strain treated with AmB vs. transformed yeasts treated with AmB. (b) Hemocyte density in hemolymph samples collected 48 h after P. brasiliensis infection; asterisks indicate statistical significance (*** p < 0.0001) vs. ov-PCN+amphotericin B. Larvae inoculated with PBS or amphotericin B were used as controls.
Figure 6. PCN effects on the susceptibility of P. brasiliensis yeasts to amphotericin B (AmB), according to histological findings in infected G. mellonella larvae. G. mellonella larvae were infected with yeasts from different P. brasiliensis strains and treated, 1 hour after, with amphotericin B, 0.5 mg/kg. At 48 h post-infection, larvae were euthanized, and body sections were PAS-stained. Images were captured from larvae infected with wt-PCN yeasts (c); ov-PCN yeasts (d); kd-PCN yeasts (e); and EV yeasts (f). PBS: uninfected larvae, inoculated with phosphate-buffered saline (PBS) instead of yeasts (a). Amphotericin B: uninfected larvae inoculated with amphotericin B (0.5 mg/kg) (b). 20X amplification (a-f). Enlarged views of the images (g-l). Bars indicate 1 mm on A-E, 2 mm at F, and 200 µm at G-L. Black arrows indicate P. brasiliensis yeast aggregates; a, cuticle; b, adipose bodies; c, granuloma-like structure; d, fungal cells.
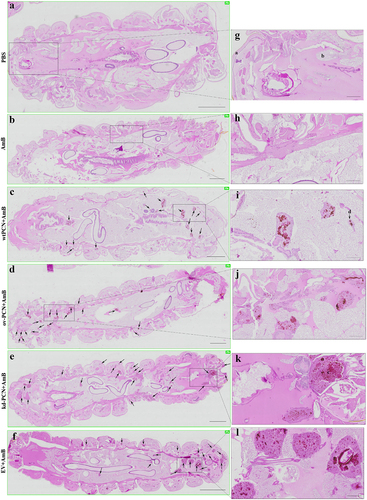
Figure 7. Relative expression of genes related to cell wall remodeling in PCN-transformed P. brasiliensis yeasts. the yeasts for RNA extraction were obtained after 72 h of culturing. Samples converted to cDNA were analyzed for the relative expression of PbFKS1 (a), PbCHS3 (b), PbCSR1 (c), PbNAG1 (d), PbBGN1 (e), PbBGN2 (f), and PbAGN (g) using RT-quantitative PCR. The Ct values of the transcripts were normalized to the relative expression of the endogenous control L34. Results are expressed as mean ± SD, and the relative expression levels were compared between yeast transformants (ov-PCN or kd-PCN) and the EV-control group. *p < 0.05, **p < 0.001, and ***p < 0.0001.
Supplemental Material
Download MS Word (843.6 KB)Data availability statement
The authors confirm that the data supporting the findings of this study are available within the article.