Figures & data
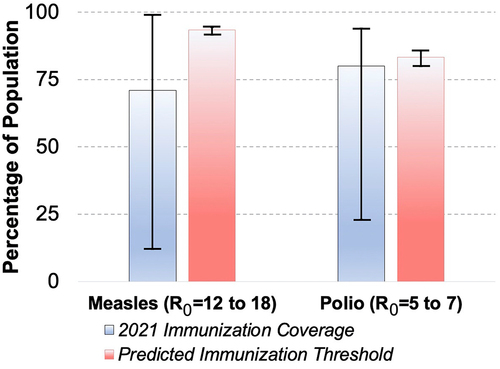
Figure 1. Diminishing Global Immunization Coverage Using data reported by the WHO, global levels of immunization against poliovirus and measles virus are graphed with bar included to show the immunization rate in the countries with both the maximum immunization rate and minimum rate. Using the estimated R0, the basic reproduction number of the virus, herd immunity thresholds were calculated with the formula 1 − 1/R0 and graphed for both poliovirus and measles with the maximum and minimum predicted. Overall, this shows that different countries fall dangerously outside of the herd immunity thresholds highlighting public intervention targets.