
Figures & data
Figure 1. The genetic structures of ZrgABCDE-like systems in Vibrionaceae. The structures were based on the following genomes: V. parahaemolyticus RIMD2210633, NC_004603.1; V. cholerae N16961, NC_002505.1; V. vulnificus CMCP6, NC_004459.3; V. campbellii ATCC BAA-1116, NC_009783.1; V. shilonii AK1 1,103,207,001,947, NZ_ABCH01000030.1; V. atlanticus LGP32, NC_011753.2; V. fischeri ES114, CP000020.2; A. salmonicida LFI1238, NC_011312.1; and P. profundum SS9, NC_006370.1.
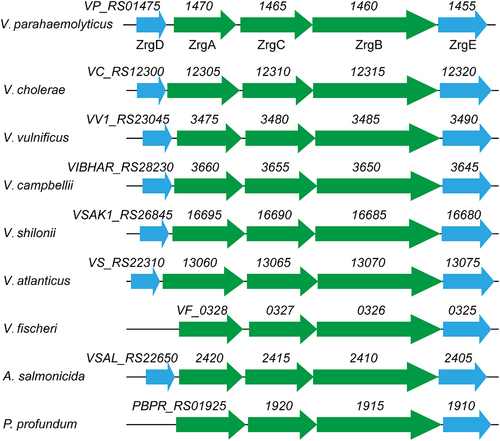
Figure 2. The transcriptome of V. parahaemolyticus is altered in response to Zn limitation. (a) the transcriptome change under Zn-deficient conditions compared to Zn-replete conditions. DEGs, up, and down represent the differentially expressed genes, upregulated genes, and downregulated genes, respectively. (b) the top 20 enriched KEGG pathways of the DEGs. The KEGG pathways with a q value <0.05 were considered significantly enriched. (c) Heatmap showing the expression of genes in the Zur regulon based on the TPM (transcripts per million) values. Zn-deficient_rep1–3 and Zn-replete 1–3 represent the three biological replications of Zn-deficient and Zn-replete conditions, respectively.
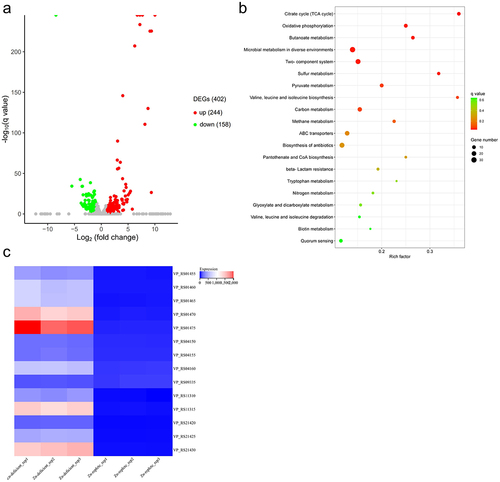
Figure 3. V. parahaemolyticus upregulates the expression of genes encoding Zn-binding proteins in response to Zn deficiency. Bar plots representing the mean ± standard deviations of the expression levels of these genes in RIMD2210633 grown in the conditions of interest obtained through quantitative PCR. The data were obtained from three independent experiments. ***, P <0.0001.
Table 1. Expression of Zur regulon under Zn-deficient conditions compared to Zn-replete conditions.
Figure 4. VP_RS01470 is required for V. parahaemolyticus growth under Zn-deficient conditions. (a-d) the strains were grown in LB pretreated with DMSO (a), 30 μM (b), 35 μM (c), or 40 μM TPEN (d). (e) the strains were grown in TPEN (35 μM)-treated LB supplemented with 20 μM Zn. At least three independent experiments were performed for each condition. The data represent the mean ± standard deviations from three wells in an independent experiment.
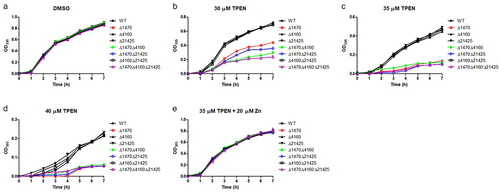
Figure 5. Growth curves of the V. parahaemolyticus strains under Zn-deficient and Zn-replete conditions. (a-d) the strains were grown in LB pretreated with DMSO (a), 30 μM (b), 35 μM (c), or 40 μM TPEN (d). (e) the strains were grown in TPEN (35 μM)-treated LB supplemented with 20 μM Zn. At least three independent experiments were performed for each condition. The data represent the mean ± standard deviations from three wells in an independent experiment.
Figure 6. Reduced swimming motility of VP_RS01470 deletion mutant under Zn-deficient conditions. The strains were grown on LB agar supplemented with DMSO (a), 35 μM TPEN (b), or 35 μM TPEN along with 20 μM Zn (c). The images are representative of at least three independent experiments.
Figure 7. The expression of the polar flagellar-related genes in the WT and Δ1470 strains grown under Zn-deficient conditions. The first gene in each operon was chosen for quantitative PCR analysis. Bar plots representing the mean ± standard deviations of the expression levels of these genes in the strains of interest. The data were obtained from three independent experiments. *, P <0.05; **, P <0.01; ***, P <0.001.
Figure 8. Survival of mice infected with the V. parahaemolyticus strains. No significant difference in survival rates was observed between the groups.
Figure 9. Zur Negatively regulates VP_RS01470 in V. parahaemolyticus. (a) Bar plots representing the mean ± standard deviations of the expression levels of VP_RS01470 in the strains of interest obtained through quantitative PCR. The data were obtained from three independent experiments. (b) β-galactosidase activity of the WT strain or Δzur harbouring either pDM8 or pDM8 containing the promoter of the operon VP_RS01475 to VP_RS01455. The data represent the mean ± standard deviations from three biological replicates.
Supplemental Material
Download MS Word (2 MB)Data availability statement
The authors confirm that the data supporting the findings of this study are available within the article and its supplementary materials