1,537
Views
1
CrossRef citations to date
0
Altmetric
Research Article

Epithelial cell invasion by salmonella typhimurium induces modulation of genes controlled by aryl hydrocarbon receptor signaling and involved in extracellular matrix biogenesis

, , , , , , , & ORCID Icon show all
Article: 2158663 | Received 18 May 2022, Accepted 11 Dec 2022, Published online: 04 Jan 2023

Figures & data

Table 1. Characteristics and designation of the strains used in this study.

Figure 1. Invasion of IEC-6 cells by S. Typhimurium strains entering cells by different entry pathways.

Using a gentamicin assay invasion capabilities of S. Typhimurium strains capable of entry by both trigger and zipper mechanisms (STM-ZT), by a trigger (STM-T) or zipper (STM-Z) entry mechanism, or by none of the known mechanisms (STM-3d) were compared. Bacteria were deposited on IEC-6 with a multiplicity of infection of 10, for 1.5 h, then gentamicin was added (100µg/ml) for 1.5 h. Intracellular bacteria levels were assessed after cell lysis. This result corresponds to the mean of 6 independent experiments. Statistical analyses using a Mann Whitney test were performed using GraphPad Prism version 6.07 for Windows. (Significance was *** at p<0.001, ** at p<0.01, * at p<0.05.
Figure 1. Invasion of IEC-6 cells by S. Typhimurium strains entering cells by different entry pathways.

Table 2. Paired comparisons of gene expression modification induced in IEC-6 cells exposed to the S. Typhimurium strains STM- Z T, STM- Z, or STM- T.

Figure 2. Specific and shared differentially expressed genes between IEC-6 cells exposed to STM-ZT, STM-Z or STM-T strains compared to non-exposed cells (cont).

Venn diagram showing the number of specific and shared differentially expressed (DE) genes (exposed/non-exposed cells) obtained after a whole-expression genomic profiling of IEC-6 cells infected by STM-ZT, STM-Z or STM-T strains. Gene expression analyzes were performed after 1.5 h of interaction between IEC-6 and STM strains and 1.5 h of gentamicin to kill extracellular bacteria. DE genes with a p value <0.05, and a fold change (FC) > |2| are represented.
Figure 2. Specific and shared differentially expressed genes between IEC-6 cells exposed to STM-ZT, STM-Z or STM-T strains compared to non-exposed cells (cont).

Figure 3. Functional enrichment analysis of biological processes.

Analysis of differentially expressed (DE) genes (exposed/non-exposed cells) obtained after a whole-expression genomic profiling of IEC-6 cells infected by STM-ZT, STM-Z or STM-T strains. Gene expression analyses were performed after 1.5 h of interaction between IEC-6 and STM strains and 1.5 h of gentamicin to kill extracellular bacteria. Clustering heatmap plot of functional sets of gene ontology (GO) terms was obtained using ViSEAGO showing the major biological processes. The plot combines a dendrogram based on Wang’s semantic similarity distance and ward.D2 aggregation criterion, a heatmap of -log10(p-value) from functional enrichment tests and information content (IC). Focus is made on several major biological processes. For the sake of clarity, we only kept the genes showing high levels of expression |log10(FC)| > 5).
Figure 3. Functional enrichment analysis of biological processes.

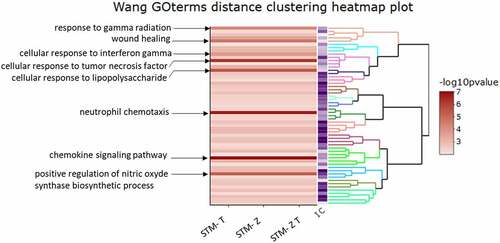
Table 3. Differentially expressed genes in the microarray experiment associated with stimulation or inhibition of the ECM.

Table 4. Differentially expressed genes included in the IPA upstream regulator analysis that may be activated by the AHR pathway.

Table 5. Comparison of gene expression determined by microarray and qRT PC.

Figure 4. Invasion of the STM-ZT and STM-3d strains impaired for entry by pharmaceutical means.

Invasion ability of the STM-ZT and STM-3d was analyzed using a gentamicin protection assays in the presence of 1 mM amiloride (Am) and 10 µg/mL chlorpromazine (CPZ). IEC-6 cells were pre-treated for 30 min with the drugs, or with the appropriate solvent used for the dilution of the drugs as control. Infection was performed in the presence of the drugs; bacteria were deposited on IEC-6 with a multiplicity of infection of 10, for 1.5 h, then gentamicin was added (100µg/ml) for 1.5h. Intracellular bacteria levels were assessed after cell lysis. This result corresponds to the mean of five independent experiments. Relative invasion corresponds to the number of internalized bacteria in cells treated relative to the non-treated cells infected by STM-ZT arbitrarily set at 100%.
Figure 4. Invasion of the STM-ZT and STM-3d strains impaired for entry by pharmaceutical means.

Table 6. Expression profile of selected ECM-associated genes in IEC-6 cells treated or not with chlorpromazine and amiloride before and during infection with the STM-Z T strain.

Figure 5. Western blotting analysis of IEC6 cells infected by the different S. Typhimurium strains.

Alteration of Extracellular Matrix Proteins (ECM) after bacterial invasion is illustrated by western blotting analysis of laminin and fibronectin. Bacteria were deposited on IEC-6 with a multiplicity of infection of 10, for 1.5 h, followed by gentamicin (100µg/ml) for 1.5 h. Cells were then resuspended in Laemmli buffer and denaturated 10 min at 100°C. Samples from Non-infected cells (NI) and cells infected by STM-ZT, STM-Z, STM-T or STM-3d strains were loaded in a 4-15% Miniprotean TGX Precast Protein gels and then transferred to a nitrocellulose membrane followed by detection of laminin (A) and fibronectin (B). Protein concentrations were normalized to the tubulin-blotting reference and the ratios were expressed relative to non-infected cells. The Regions of interest (ROI) taking into account for this normalization are represented by the rectangles.
Figure 5. Western blotting analysis of IEC6 cells infected by the different S. Typhimurium strains.
Supplemental material

Supplemental Material

Download Zip (1.8 MB)

Data availability statement

The data that support the findings of this study are available in the GEO database with the accession number GSE151881.