
Figures & data
Figure 1. ELMO1 binds the LRR domain of NOD2 through the C terminal end. a. HEK293 cells were co-transfected with Flag-ELMO1 and HA-NOD2. After transfections, cells were lysed, normalized for protein content and precipitated using anti-FLAG antibody. Immunoprecipitants and cell lysates were visualized by immunoblotting with corresponding antibodies. b. the schematic shows the structure of NOD2 protein and associated mutations involved in IBD. To detect the regions of NOD2 that bind ELMO1, Pulldown assay using GST, GST-ELMO1 full length (FL) and GST-ELMO1 C-terminal (CT) were immobilized on glutathione beads. The soluble recombinant his-NOD2 CARD or his-NOD2 LRR proteins were incubated with the beads. Bound NOD2 proteins in the pull down and in the input were determined using anti-his antibody. The ponceau staining in the lower panel showed the equal loading of GST tagged proteins. c. GST pulldown assay using GST NOD2 LRR with recombinant his-ELMO1 FL or his-ELMO1 CT followed by immunoblotting using anti-His antibody. The ponceau staining in the lower panel showed the equal loading of GST tagged proteins. The densitometry of the pulldowns shown in the graph is from three independent experiments where the mann whitney U test showed the p value of<0.01 represented as **.
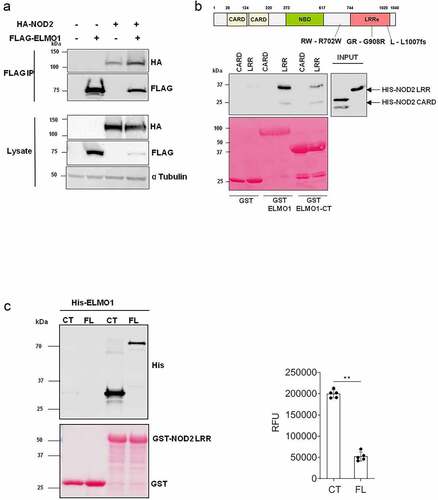
Figure 2. The involvement of NOD2 mutant in bacterial clearance and in inflammation. a. HEK293 cells were co-transfected with Flag-ELMO1 and with HA-NOD2 [WT and mutant (GR - G908 R, RW – R702W, L - L1007fs)]. After transfections, cells were lysed, normalized for protein content and precipitated using anti-FLAG antibody. Immunoprecipitants and cell lysates were visualized by immunoblotting with corresponding antibodies. b. HEK293 cells were transfected with vectors over-expressing ELMO1 and BAI1, with either NOD2 WT or NOD2L1007fs (Mutant L). Cells were infected with AIEC-LF82 for 6h and gentamicin was used to kill extracellular bacteria. The bacterial count at 6 h and 24 h were plotted from three different experiments. c. the supernatant from B at 24 h was used to measure cytokine by ELISA.Results shown are mean ± SEM Mann Whitney test showed p value of < 0.01 represented as**.
![Figure 2. The involvement of NOD2 mutant in bacterial clearance and in inflammation. a. HEK293 cells were co-transfected with Flag-ELMO1 and with HA-NOD2 [WT and mutant (GR - G908 R, RW – R702W, L - L1007fs)]. After transfections, cells were lysed, normalized for protein content and precipitated using anti-FLAG antibody. Immunoprecipitants and cell lysates were visualized by immunoblotting with corresponding antibodies. b. HEK293 cells were transfected with vectors over-expressing ELMO1 and BAI1, with either NOD2 WT or NOD2L1007fs (Mutant L). Cells were infected with AIEC-LF82 for 6h and gentamicin was used to kill extracellular bacteria. The bacterial count at 6 h and 24 h were plotted from three different experiments. c. the supernatant from B at 24 h was used to measure cytokine by ELISA.Results shown are mean ± SEM Mann Whitney test showed p value of < 0.01 represented as**.](/cms/asset/0a1c9936-1767-49eb-a142-fb61b6a100c1/kvir_a_2171690_f0002_b.gif)
Figure 3. The impact of ELMO1 and NOD2 in bacterial entry and viability in murine ileal EDMs. a. Enteroid-derived monolayers (EDMs) from age and gender matched WT, NOD2 KO and ELMO1 KO mouse were infected with AIEC-LF82 for 8 h. GSK717, a pharmacologic inhibitor of NOD2 was used in ELMO1 KO EDMs to inhibit NOD2 signalling. Transepithelial electrical resistance (TEER) was measured at time intervals and plotted as percentage change at 8 h compared to 0 h. b. the same EDMs from (a) were infected with AIEC-LF82; the bacterial internalization determined at 3 h has been plotted as colony-forming units (cfu/mL) and bacterial survival was measured at 12 h where the fold change was calculated considering WT EDMs as 1.Results shown are mean ± SEM as determined by Mann–Whitney U test. p value is considered significant if the value < 0.05, < 0.01 < 0.001 and < 0.0001 represented as *, **, *** and **** respectively.
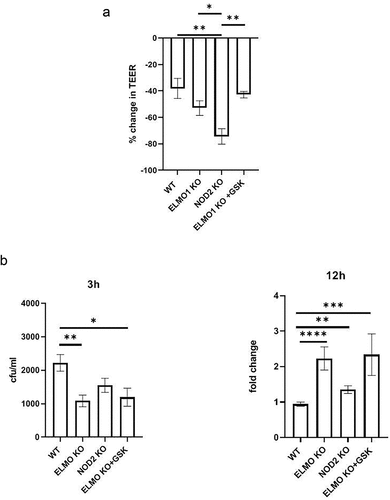
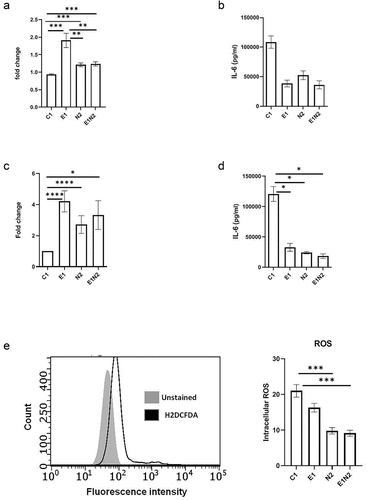
Figure 4. The impact of ELMO1-NOD2 interaction in bacterial clearance and inflammation in macrophages after AIEC-LF82 infection. a. J774 cells were infected with AIEC-LF82 for 1 h, after which extracellular bacteria were killed by gentamicin treatment. Cells were incubated for 12 h, then lysed, serially diluted, and plated for colony-forming units (cfu). For bacterial survival at 12 h, the cfu at 12 h were normalized to the cfu of bacterial entry at 1 h for each of the respective macrophages. The graph represents the fold change in the bacterial survival, at 12 h calculated by considering bacterial survival of C1 as 1 and the relative bacterial survival in other cells are compared to C1. b. The level of pro-inflammatory cytokines (IL-6) secreted in supernatants collected at end of 12 h from “A.” c. Murine macrophages were exposed to SL1344 for 1 h, after which extracellular bacteria were killed by gentamicin treatment. Cells were incubated for 12 h, then lysed, serially diluted, and plated for cfu. For bacterial survival at 12 h, the cfu at 12 h were normalized to the cfu of bacterial entry at 0 min for each of the respective macrophages. The graph represents the fold change in the bacterial survival, at 12 h calculated by considering bacterial survival of C1 as 1 and the relative bacterial survival in other cells are compared to C1. d. the level of pro-inflammatory cytokines (IL-6) secreted in supernatants collected at end of 12 h from “C.” e. J774 macrophages were infected with AIEC-LF82 infection for 30 min, followed by treatment with high gentamicin and 1 µM H2DCFDA for 60 min. Cells were then washed and analysed on a flow cytometer for detection of total cellular ROS. Bar graph on right show percent of cells expressing ROS, data is displayed as mean ± SEM. Graph shows transcript levels after infection.Results shown are mean ± SEM as determined by Mann–Whitney U test. p value is considered significant if the value < 0.05, < 0.01 < 0.001 and < 0.0001 represented as *, **, *** and **** respectively.
Supplemental Material
Download Zip (2.6 MB)Data availability statement
Data of this study is present in the main text and supplementary materials.