
Figures & data
Figure 1. Metabolomic analysis of WT-GBS and AR-GBS (a) MIC between WT-GBS and AR-GBS. (b) Reproducibility of metabolomic data. (c) Categories of identified differential metabolites. (d) Heat map showing relative abundances of metabolites in AR-GBS and WT-GBS. Yellow and blue indicate increased and decreased metabolite levels relative to the median metabolite level, respectively (see the colour scale). (e) Heatmap showing relative abundances of differential metabolites between AR-GBS and WT-GBS. Yellow and blue indicate increased and decreased metabolite levels relative to the median metabolite level, respectively (see the colour scale). (f) Z-score plots (e). The data from AR-GBS are separately scaled to the mean and standard deviation of WT-GBS. Each point represents replicate and colour indicating sample type. Black and Red represent WT-GBS and AR-GBS, respectively.
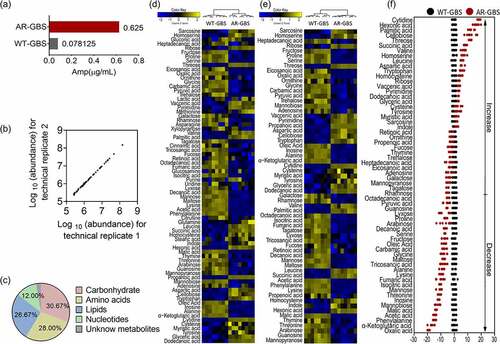
Figure 2. Biomarkers and pathways differentiating WT-GBS and AR-GBS. (a) Pathway enrichment analysis. (b) the volume of the differential metabolites of AR-GBS compared with WT-GBS. The colour of blue indicates metabolites of decreased abundance; yellow indicates metabolites of increased abundance.
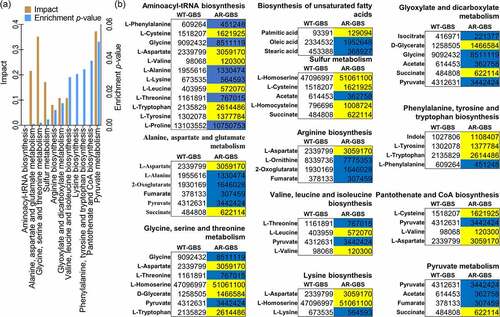
Figure 3. Glycolysis is impaired in AR-GBS (a) Real-time quantitative reverse transcription-PCR (qRT-PCR) for genes expression of the glycolysis. (b, c) Activity of PFK, GAPDH, PK and PDH of WT and AR in 5 ml 25% BHI medium (OD600 = 0.2) at 37 °C for 6 h. (d) ATP, NADH and Membrane potential (PMF) of WT and AR in 5 ml 25% BHI medium (OD600 = 0.2) at 37 °C for 6 h. Results are displayed as mean ± standard errors of the means (SEM) (N ≥ 3 technical replicates per sample), and statistically significant differences are identified by t-test. *, p < 0.05, **, p < 0.01. Each experiment was repeated independently at least three times.
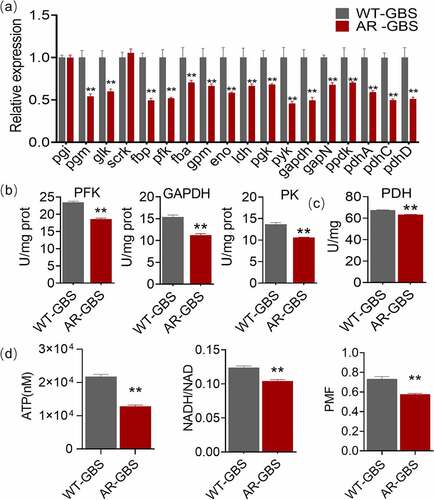
Figure 4. Multivariate analysis of metabolomic data (a) PCA score plot. Each dot corresponds to an individual sample. Black and Red represent WT-GBS and AR-GBS respectively. (b) S-plot. Each circle represents individual metabolite, which is greater or equal to 0.05 and 0.5 for the absolute value of covariance p and correlation p(corr) respectively. (c) Scatter plot showing the relative abundance of fructose and pyruvate from data (b).
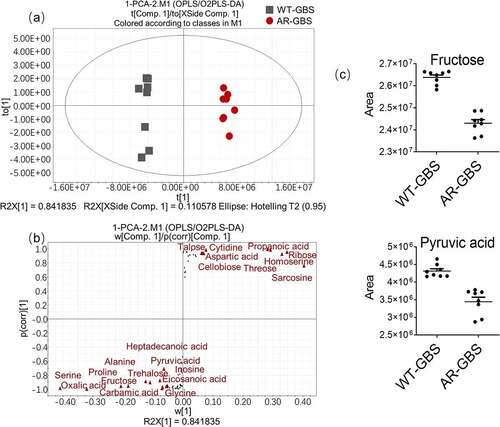
Figure 5. Fructose potentiates ampicillin to kill AR-GBS. (a) Percent survival of AR-GBS in the presence of the indicated metabolites plus Amp. (b) Percent survival of AR-GBS in the indicated concentrations of fructose plus 1/2 MIC Amp. (c) Percent survival of AR-GBS in the indicated concentrations of Amp plus 20 mM fructose. (d) Percent survival of AR-GBS in 20 mm fructose plus 1/2 MIC Amp at the indicated incubation periods. (e) Percent survival of clinical isolated MRSA8, MRSA18, S2-lac and TMM2 in the indicated concentrations of Amp plus 20 mM fructose. (f, g) Killing effect of the indicated concentrations of Amp plus 20 mM fructose in treating persisters and bacterial biofilms. (h) Percent survival of zebrafish infected with AR-GBS in the presence or absence of Amp, fructose or both. Results are displayed as mean ± standard errors of the means (SEM) (N ≥ 3 technical replicates per sample), and statistically significant differences are identified by t-test. *, p < 0.05, **, p < 0.01. Each experiment was repeated independently at least three times.
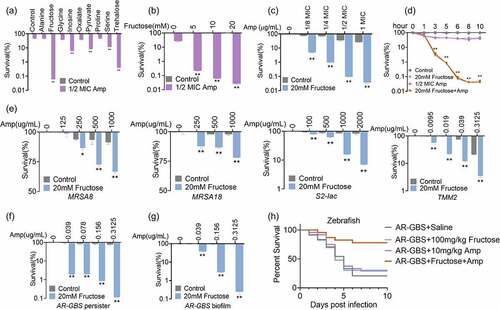
Figure 6. Fructose promotes glycolysis. (a) qRT-PCR for expression of genes in glycolysis in the absence and presence of fructose. (b) Activity of PFK, GAPDH and PK of AR in the absence and presence of fructose. (c) ATP and NADH of AR in the absence and presence of fructose. (d) Percent survival of AR in the presence of fructose plus Amp and effect of 3-bromopyruvate and shikonin. Results are displayed as mean ± standard errors of the means (SEM) (N ≥ 3 technical replicates per sample), and statistically significant differences are identified by t-test. *, p < 0.05, **, p < 0.01. Each experiment was repeated independently at least three times.
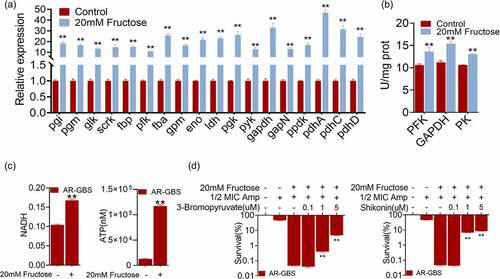
Figure 7. Fructose increases intracellular Amp. (a) Intracellular Amp between WT-GBS and AR-GBS. (b) Intracellular Amp of AR-GBS being treated with indicated concentrations of fructose plus Amp. (c) Intracellular Amp of AR-GBS being treated with 20 mM or fructose plus 3-bromopyruvate or shikonin. (d) PMF of AR-GBS in the absence and presence of fructose. (e) Percent survival of AR-GBS in the presence of fructose plus Amp and effect of m-chlorophenyl hydrazone (CCCP). (f) Intracellular Amp of AR-GBS in the presence of fructose plus Amp or plus CCCP. Results are displayed as mean ± standard errors of the means (SEM) (N ≥ 3 technical replicates per sample), and statistically significant differences are identified by t-test. *, p < 0.05, **, p < 0.01. Each experiment was repeated independently at least three times.
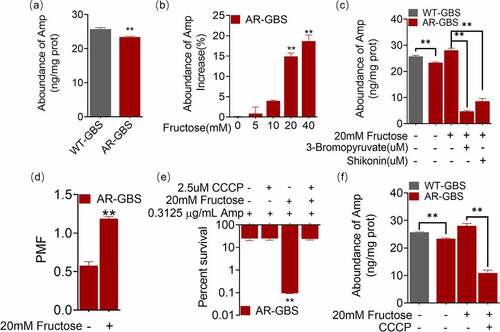
Figure 8. Fructose promotes the expression of pBps. (a) Annotation for mutations of AR-GBS identified from mutants against to WT-GBS. (b) qRT-PCR for expression of pBps in the absence and presence of fructose. (c) the abundance of pBps in WT or AR in the absence and presence of fructose and effect of 3-bromopyruvate and shikonin. Results are displayed as mean ± standard errors of the means (SEM) (N ≥ 3 technical replicates per sample), and statistically significant differences are identified by t-test. *, p < 0.05, **, p < 0.01. Each experiment was repeated independently at least three times.
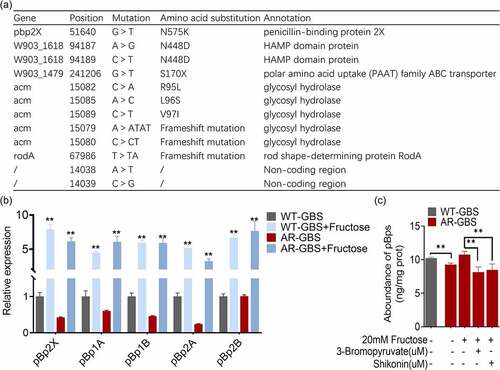
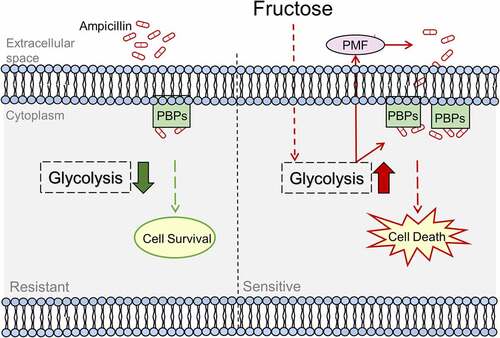
Figure 9. Proposed Model. Ampicillin-resistant GBS has reduced ampicillin uptake that causes low level of intracellular concentration of ampicillin and ampicillin targets, penicillin-binding proteins (PBPs). While exogenous fructose activates glycolysis to enhance ampicillin uptake and PBPs to reverse ampicillin resistance.
Supplemental Material
Download MS Word (484 KB)Data availability statement
The data that support the findings of this study are openly available in this manuscript and supplementary files.