
Figures & data
Table 1. The primers used for quantitative PCR.
Figure 1. Changes in morphology, histopathology, and the transcription levels of genes involved in the innate immune response in IBV-infected testis. (a) Gross lesions of testis at 4 and 8 dpi. Red arrows indicate morphological abnormalities of the testis. (b) Gonadosomatic index (GSI), expressed as the ratio of testicular weight to body weight (n = 5). Data are presented as the mean±sem. P < 0.05 (*). (c) Histopathological changes detected in cross sections of testis. Black arrows indicate macrophages, and red arrowheads indicate neutrophils. Abbreviations: S, seminiferous tubule; I, interstitium; L, lumen; Sp, spermatogonium; Ps, primary spermatocyte; Sd, spermatid; Sz, spermatozoon; Sc, Sertoli cell. (d) Perimeter of the seminiferous tubule. The seminiferous tubules were selected randomly, and the data were measured in triplicate (n = 30). Data are presented as the mean±sem. P < 0.05 (*), P < 0.0001 (****). (e) the mRNA expression levels of genes involved in the innate immune response in the testis (n = 5). Values are expressed as the mean±sem of the fold change. P < 0.05 (*), P < 0.01 (**), P < 0.001 (***).
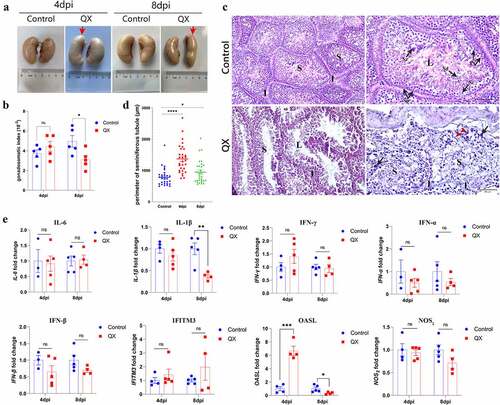
Figure 2. Changes in histopathology and the transcription levels of genes involved in the innate immune response in the IBV-infected ductus deferens. (a) Histopathological changes detected in cross sections of the ductus deferens. White arrowheads: lost cilia and damaged mucosal epithelium; black arrowheads: congestion in the mucous layer; black arrows: diffuse hemorrhagic spots; red arrows: lymphocytes. (b) the mRNA expression levels of genes involved in the innate immune response in the ductus deferens. Values are expressed as the mean±sem of the fold change (n = 5). P < 0.05 (*), P < 0.01 (**).
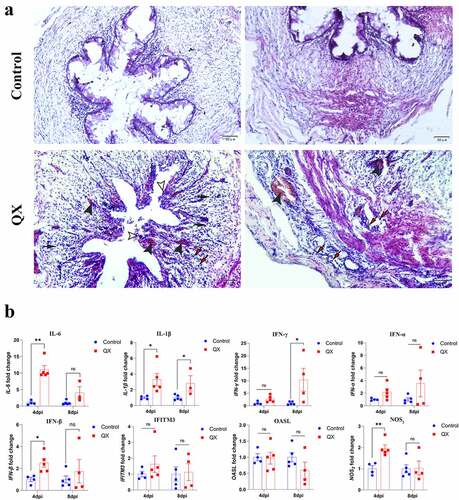
Figure 3. Detection of the viral antigen distribution and viral loads in the testis and ductus deferens by IHC staining and qRT‒PCR. (a) Results of IHC staining. Black arrows indicate antigen deposition. (b) Quantification of viral RNA. The dotted line represents the limit of detection (LOD). Error bars represent the standard error (n = 5). P < 0.05 (*), P < 0.0001 (****).
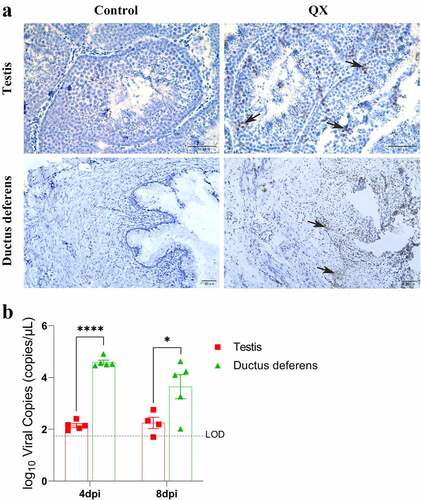
Figure 4. Effects of IBV infection on the concentrations of reproductive hormones in the plasma and the transcription levels of corresponding receptors in the testis. (a) Detection of the concentrations of testosterone (T), follicle-stimulating hormone (FSH), luteinizing hormone (LH) and estrogen (E2) in the plasma by ELISA. (b) Detection of the mRNA expression levels of androgen receptor (AR), follicle-stimulating hormone receptor (FSHR), and luteinizing hormone receptor (LHR) in the testis by qRT‒PCR. Values are expressed as the mean±sem (n = 5). P < 0.05 (*), P < 0.01 (**).
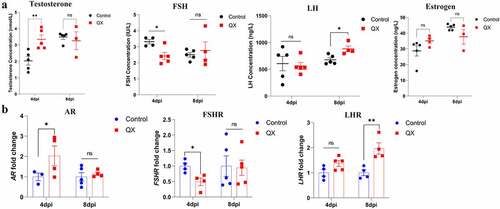
Figure 5. Effects of IBV infection on the mRNA expression levels of key enzymes involved in steroidogenesis. Values are expressed as the mean±sem (n = 5). P < 0.05 (*) and P < 0.01 (**).
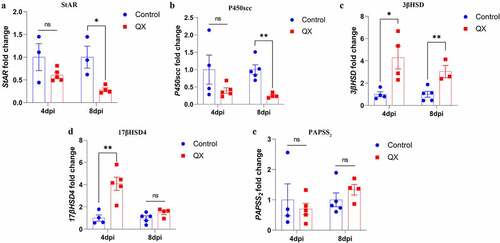
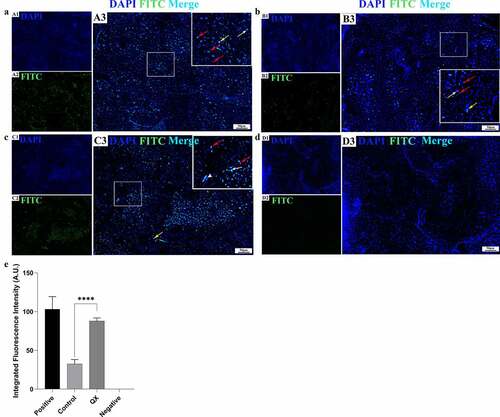
Figure 6. Detection of IBV-induced cellular apoptosis in the testis by TUNEL assay at 4 dpi. (a): Positive control section treated with a DNase I reaction mixture. (b): Control group. (c): QX group. (d): Negative control section treated without a TdT Enzyme reaction mixture. (A1-D1): The cell nuclei were stained with DAPI. (A2-D2): The apoptotic cells were observed via the green fluorescence of FITC. (A3-D3): Merge of blue and green fluorescence. Red arrows: spermatogenic cells; white arrows: Sertoli cells; white arrowhead: myoid cell; yellow arrows: Leydig cells. (E): The green fluorescence intensity representing the level of apoptosis. Error bars represent the standard error (n = 5). P < 0.0001 (****).
Data availability statement
All of the data extracted for this study are included in the manuscript.