
Figures & data
Figure 1. Study design, survival curve, and clinical assessment of ESKAPEE pathogens in BALB/c mice. (a) Animals were immunosuppressed with 150 mg/kg cyclophosphamide (CP) at Day−4 and 100 mg/kg at Day−1 and then inoculated with one of the ESKAPEE pathogens or sterile saline (Naïve). Clinical observations were made every 4 hours post-inoculation (HPI) throughout the assessment period. Animals were removed from the study if they were found dead in cage (FDIC). Surviving animals were euthanized at Day 7. (b) Percent survival by group. P-values represent the significance between mice inoculated with one of the ESKAPEE pathogens vs. the naïve group. For E. faecium, P = 0.0428. For the remaining pathogens, P < 0.0001. (c) Cumulative clinical scoring demonstrates disease progression over time. The dotted line represents euthanasia of naïve mice.
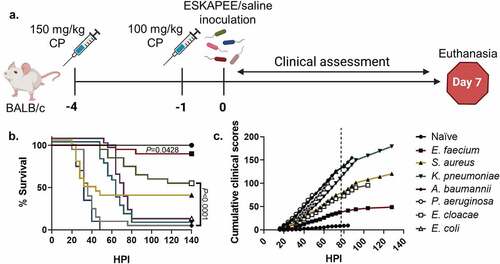
Table 1. Clinical scoring point value assignment for selected clinical signs.
Table 2. Clinical parameter measurements post-inoculation with ESKAPEE pathogens in comparison to naïve controls.
Figure 2. Assessment of weight loss vs. hours post-inoculation (HPI) with ESKAPEE pathogens in BALB/c mice. Each animal was weighed every 12 hours at noon and midnight. The starting weight for each mouse was calculated as the average of the 3 weights taken on Days−4, −1, and Day 0. Weight loss percentage was calculated against that average starting weight and is represented as a change from 100% of the original weight. Mixed-effects analysis with Dunnett’s multiple comparisons test was used to determine statistical significance. Compared against naïve mice, weight loss was statistically significant in all inoculated groups. (a) Naïve mice. (b) Mice inoculated with E. faecium (P < 0.0001). (c) Mice inoculated with S. aureus (P < 0.0001). (d) Mice inoculated with K. pneumoniae (P < 0.0001). (e) Mice inoculated with A. baumannii (P < 0.0001). (f) Mice inoculated with P. aeruginosa (P = 0.0021). (g) Mice inoculated with E. cloacae (P < 0.0001). (h) Mice inoculated with E. coli (P < 0.0001).
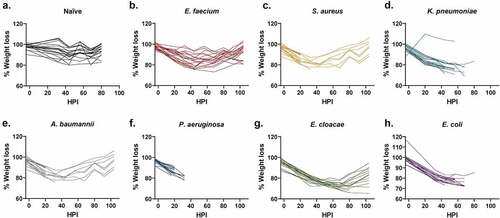
Figure 3. Assessment of internal temperature vs. hours post-inoculation (HPI) with ESKAPEE pathogens in BALB/c mice. ESKAPEE pathogen inoculated mice are presented in two groups: survivors and FDIC. A total of 19–20 mice (n ≥ 19) were used for each bacterial species (Table 2). Mixed-effects analysis was used to determine statistical significance. P-values represent the significance between mice that were survivors vs. FDIC for each ESKAPEE pathogen. The median temperature of each group and naïve animals is plotted over time. A black circle represents internal temperature for naïve mice. A white circle represents internal temperature for mice that ultimately survived. An X represents internal temperature for mice that were ultimately FDIC. Mice inoculated with (a) E. faecium, (b) S. aureus, (d) K. pneumoniae, (e) A. baumannii, (e) P. aeruginosa, (f) E. cloacae, or (g) E. coli. The dotted line represents euthanasia of naïve mice.
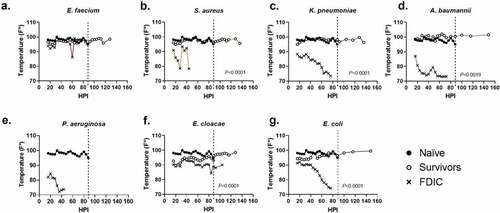
Figure 4. Assessment of external temperature vs. hours post-inoculation (HPI) with ESKAPEE pathogens in BALB/c mice. ESKAPEE pathogen inoculated mice are presented in two groups: survivors and FDIC. A total of 19–20 mice (n ≥ 19) were used for each bacterial species (Table 2). Mixed-effects analysis was used to determine statistical significance. P-values represent the significance between mice that were survivors vs. FDIC for each ESKAPEE pathogen. The median temperature of each group and naïve animals is plotted over time. A black circle represents external temperature for naïve mice. A white circle represents external temperature for mice that ultimately survived. An X represents external temperature for mice that were ultimately FDIC. Mice inoculated with (a) E. faecium, (b) S. aureus, (d) K. pneumoniae, (e) A. baumannii, (e) P. aeruginosa, (f) E. cloacae, or (g) E. coli. The dotted line represents euthanasia of naïve mice.
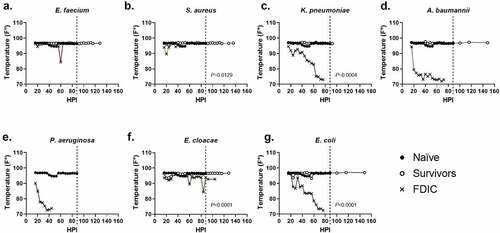
Table 3. Colony forming units of ESKAPEE pathogens in pulmonary and splenic tissue.
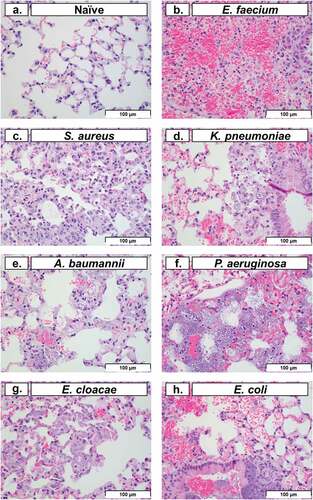
Figure 5. Histopathological analysis of pulmonary tissue post-inoculation with ESKAPEE pathogens in BALB/c mice. Hematoxylin and eosin (H&E) stained lung at 40× magnification. (a) Naïve, no abnormal findings. (b) E. faecium, alveolar septal necrosis, mild. (c) S. aureus, multifocal septal thickening, increased interstitial macrophages, increased alveolar macrophages. (d) K. pneumoniae, peribronchiolar and alveolar bacteria, septal necrosis, with septal and intrahistiocytic bacteria. (e) A. baumannii, septal necrosis, intrahistiocytic bacteria, extracellular bacteria in septa and alveoli. (f) P. aeruginosa, intracellular and extracellular bacteria, septal necrosis. (g) E. cloacae, alveolar septal necrosis, increased interstitial histiocytes, and intrahistiocytic bacteria. (h) E. coli, intrabronchiolar and alveolar extracellular bacteria, intrahistiocytic bacteria, septal necrosis, alveolar haemorrhage. Scale bars set at 100 µm.
Supplemental Material
Download MS Excel (356.3 KB)Data availability statement
The authors confirm that the study data is available within the article and supplemental materials (openly available in figshare at https://doi.org/10.6084/m9.figshare.22257727.v1).