
Figures & data
Table 1. Quantitative PCR primers used in this project.
Figure 1. Pathogen colonization is diminished in a liquid context. Young adult worms were fed P. aeruginosa PA14:dsRed (a), E. faecalis OG1RF:GFP (d), or C. albicans fRS26:GFP (g) for 24 hours on agar plates or in liquid media. Micrographs show the accumulation of fluorescent pathogens in the intestinal lumen. Scale bar 200 μm. (b, c, e, f, h) Fluorescence intensity from the pathogens within worms was quantified. Three biological replicates, of at least 50 worms each, were performed. Error bars represent SEM. p values were determined using Student’s t-test. ***p < 0.001.
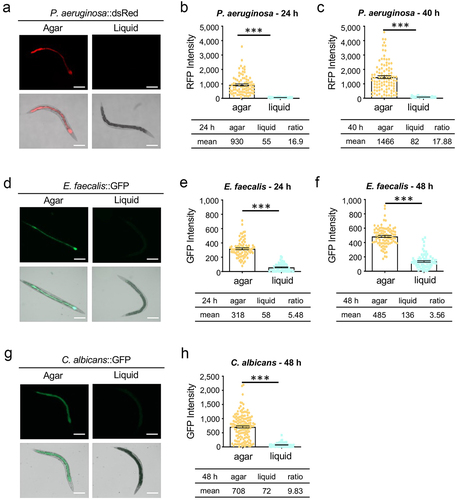
Figure 2. Worms in liquid exhibit reduced CFU for each pathogen. (a-c) Young adult worms were fed P. aeruginosa, E. faecalis, E. faecium, or C. albicans on agar or in liquid media, respectively. Worms were harvested at time points specified in figure panels. The average CFU per single worm was calculated. Each of the three biological replicates contained three technical replicates. Each of the technical replicates included 15 worms. Error bars represent SEM. p values were determined from Student’s t-test. ***p < 0.001.
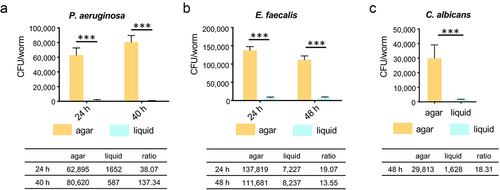
Figure 3. A liquid environment inhibits worm feeding. (a) Young adult worms were fed with fluorescent beads. Worms from agar and liquid media were imaged after 24 hours of incubation. Images show fluorescent beads in the intestinal lumen. Scale bar 200 μm. (b) Quantification of the fluorescence intensity in (a). Three biological replicates were performed with 50 worms for each replicate. Error bars represent SEM. p values were determined from Student’s t-test. ***p < 0.001.
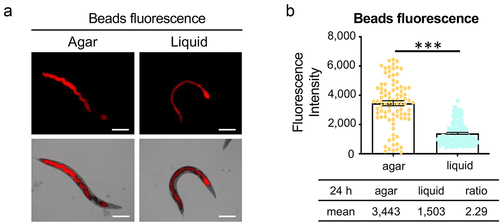
Figure 4. Disruption of host defense pathways had minimal effects on colonization. Young adult glp-4(bn2) worms reared on RNAi were transferred into PA14:dsRed, OG1RF:GFP, or fRS26:GFP in liquid media. (a-c) Survival was measured using a cell-impermeant nucleic acid stain after 55 hours (P. aeruginosa, A) or 5 days (E. faecalis (b) or C. albicans (c)). (d-f) the fluorescence of worms was measured after 24 hours to quantify colonization. Three biological replicates, each with 400 worms (a-c) or with 50 worms (d-f) were performed for each replicate. Error bars represent SEM. p values were determined from one-way ANOVA, followed by Dunnett’s test. n.s. p > 0.05; ***p < 0.001.
Figure 5. Pathogen virulence is colonization-dependent on agar plate but not in liquid. Young adult glp-4(bn2) worms were reared on empty vector, daf-2, daf-16, pmk-1, or zip-2 RNAi and then exposed to P. aeruginosa PA14:dsRed, E. faecalis OGRF1:GFP, or C. albicans fRS26:GFP in liquid- (a) or agar-based (b) contexts. Host survival and pathogenic colonization for each combination of RNAi (daf-2, daf-16, pmk-1, or zip-2) and pathogen (P. aeruginosa, E. faecalis, and C. albicans) were normalized to their empty vector group control. Data shown include all three biological replicates for each group. The relative survival and colonization were plotted. R and p values were determined from Pearson correlation.
Figure 6. Intestinal colonization contributes to E. faecalis- and C. albicans-mediated killing in liquid. (a) Data from Figure 5b were replotted without data from daf-16(RNAi) worms. (b) Intestinal fluorescence of worms exposed to E. faecalis OG1RF:GFP on agar or in liquid. (c) Survival of young adult glp-4 worms infected with E. faecalis OG1RF in liquid after 4–6 days. (d) a schematic illustrating infection conditions for panels (e-g). (e-g) Survival of young adult glp-4 worms infected with E. faecalis OG1RF (e), C. albicans (f), or P. aeruginosa (g) for 24 hours on agar and then transferred to liquid containing the same pathogen for 48 hours (e, f) or 24 hours (g). Also shown are young adult glp-4(bn2) worms exposed to E. faecalis (e), C. albicans (f), or P. aeruginosa (g) for 72 hours (e, f) or 48 hours (g) on agar or in liquid without transfer. (b-g) Data indicate results from three biological replicates, each with 30 (b) or 400 (c-g) worms. Error bars represent SEM. p values were determined from one-way ANOVA, followed by Dunnett’s test. n.s. p > 0.05; * p < 0.05; ** p < 0.01; *** p < 0.001.
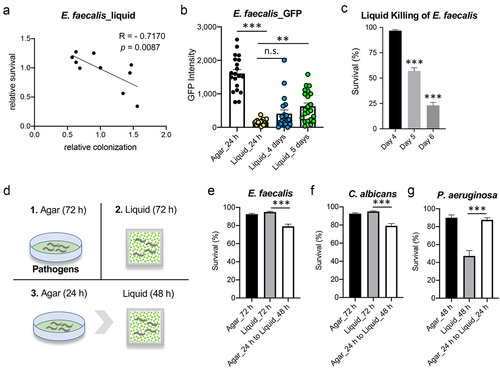
Figure 7. Transfer to liquid can stimulate clearance of P. aeruginosa from the host. (a) a schematic diagram illustrating the experimental design for panels (b) and (c). (b, c) Quantification of intestinal fluorescence from worms fed P. aeruginosa PA14:dsRed (b) or beads (c) on agar plates. After 24 hours worms were split and transferred to liquid media or new agar plates containing P. aeruginosa PA14:dsRed (b) or beads (c) for an additional 16 hours. (d) Fluorescent and transmitted light images of worms in Liquid Killing assays containing fluorescent beads and either E. coli OP50 or P. aeruginosa PA14 after 24 h. (e) Quantification of fluorescence from worms treated as in (d). At least three biological replicates, comprised of 50 worms each, were used. Error bars represent SEM. p values were determined from one-way ANOVA, followed by Dunnett’s test or Student’s t-test. n.s. p > 0.05; **p < 0.01; ***p < 0.001.
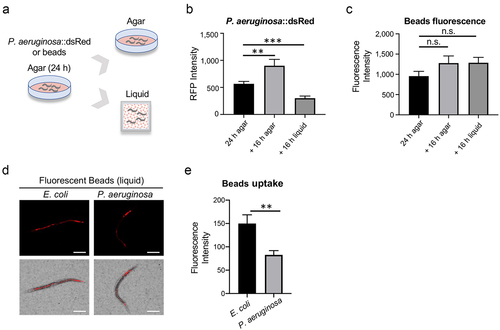
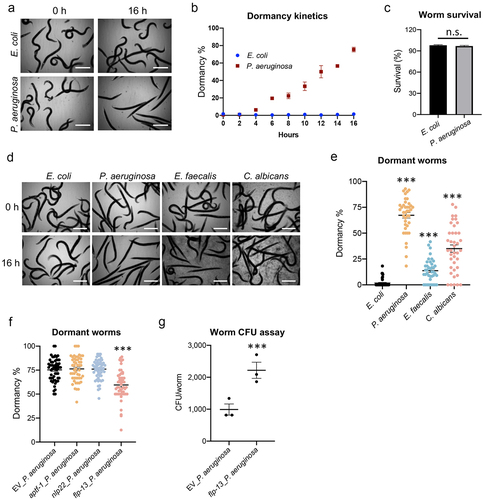
Figure 8. Pathogen-induced dormancy limits infection. (a-c) Young adult glp-4(bn2) worms were subjected to Liquid Killing assays with either E. coli OP50 or P. aeruginosa PA14 and transmitted light images were collected every 2 hours for 16 hours. (a) Representative micrographs of worms in Liquid Killing assays after 0 and 16 hours of exposure to E. coli OP50 (top) or P. aeruginosa PA14 (bottom). (b) Quantification of worms that have entered a dormant state, as determined by visual analysis. (c) Quantification of survival, as measured by a cell-impermeant nucleic acid stain, after 16 hours of Liquid Killing. (d-f) Young adult glp-4(bn2) worms were subjected to liquid-based killing assays for E. coli, P. aeruginosa, E. faecalis, or C. albicans and worms were imaged at 0 and 16 hours. (e) Quantification of worms exhibiting a dormant phenotype after exposure to each pathogen for 16 hours. (f) Quantification of dormancy in glp-4(bn2) worms reared on RNAi (empty vector (EV), aptf-1, nlp-22, or flp-13) after 16 hours of exposure to P. aeruginosa in Liquid Killing. (g) Bacterial titer from glp-4(bn2) worms reared on empty vector (EV) or flp-13(RNAi). Data shown are mean values for three biological replicates, each comprised of 20 technical replicates of 20 worms (b, c, e, f), and mean values for three technical replicates of 15 worms (g). Error bars represent SEM. p values were determined from one-way ANOVA, followed by Dunnett’s test or Student’s t-test. n.s. p > 0.05; ***p < 0.001.
Supplemental Material
Download Zip (2.7 MB)Data availability statement
The authors confirm that the data supporting the findings of this study are available within the article and its supplementary materials.