
Figures & data
Table 1. Demographic and clinical characteristics of ASP, HAM/TSP, and HCs participants subjected to small RNA analysis.
Figure 1. Volcano plots for expressed known sRNA in peripheral blood mononuclear cells (PBMCs) in the three comparison groups. Red (upregulated) and blue (downregulated) circles indicate genes with significant differences, whereas grey circles represent genes without significant differences.
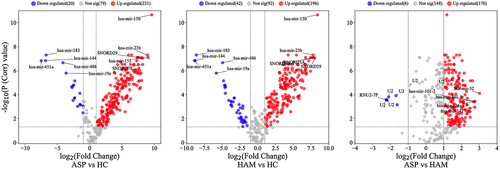
Figure 2. Heatmap showing the results of a hierarchical cluster analysis (HCA) performed independently for the three sample groups and the 182 significantly dysregulated known sRnas. The sample cluster tree is shown on the left, with the sRNA cluster tree above, forming 3 clusters selected by yellow, light green, and violet colours. The colour scale at the top indicates the relative expression level of sRNA in all samples. Red means that the expression levels are higher than the mean, while blue means that the expression levels are lower than the mean. Each column represents a known sRNA, and each row represents a sample.
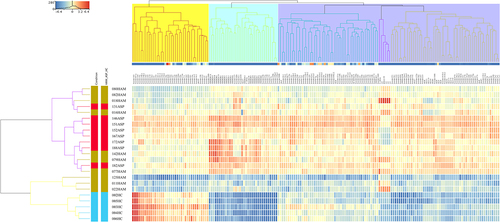
Figure 3. 3-D representation of principal component analysis (PCA) showing the distances between the three groups based on the 182 identified sRNA with significant differential regulation in all three groups.
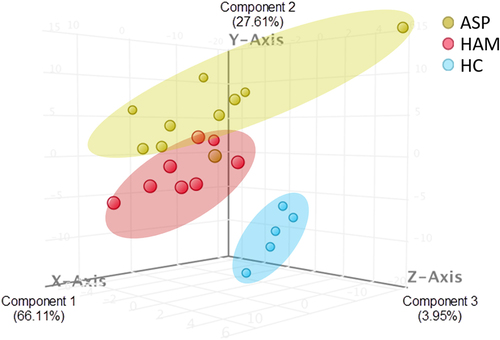
Figure 4. Volcano plots for expressed novel sRNA in peripheral blood mononuclear cells (PBMCs) in the three comparison groups. Red (upregulated) and blue (downregulated) circles indicate genes with significant differences, whereas grey circles represent genes without significant differences.
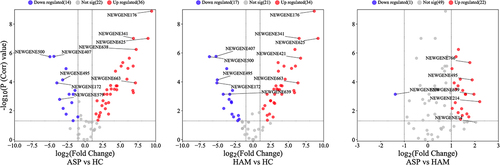
Figure 5. 3-D representation of principal component analysis (PCA) showing the distances between the three groups based on 50 significantly deregulated new sRnas in all three groups.
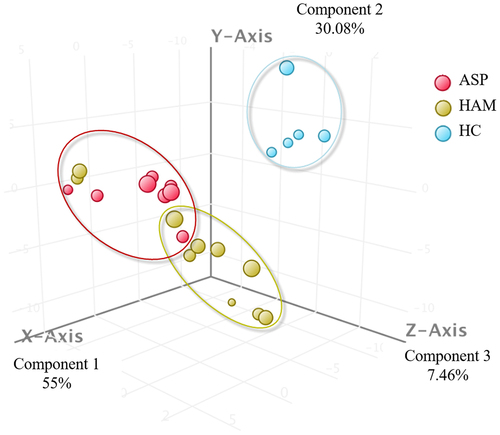
Figure 6. Volcano plots for expressed mature miRNA in peripheral blood mononuclear cells (PBMCs) in the three comparison groups. Red (upregulated) and blue (downregulated) circles indicate genes with significant differences, whereas grey circles represent genes without significant differences.
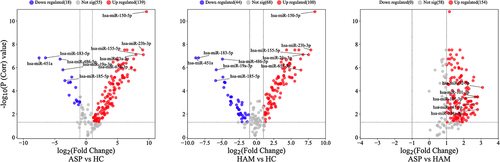
Figure 7. Heatmap showing the results of hierarchical cluster analysis (HCA) performed independently for the three sample groups and the 20 rigorously dysregulated (FDR ≤0.05 and FC of ≥ 5) mature miRnas. The sample cluster tree is shown on the left, with the miRNA cluster tree above forming two major clusters. The colour scale at the top indicates the relative expression level of sRNA in all samples. Red means that the expression levels are higher than the mean, while blue means that the expression levels are lower than the mean. Each column represents a known sRNA, and each row represents a sample.
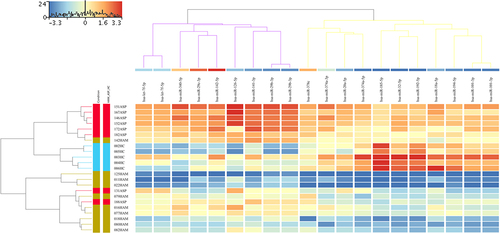
Figure 8. 3-D representation of principal component analysis (PCA) showing the distances between the three groups based on the 20 differentially expressed miRNA in all three groups.
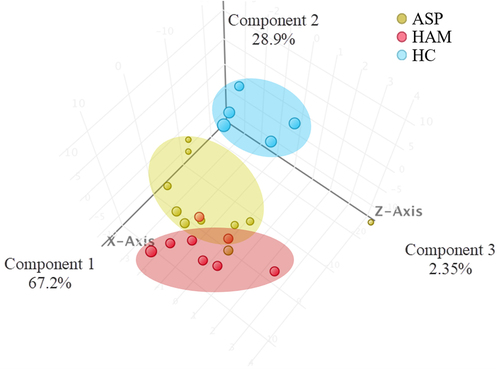
Figure 9. A Venn diagram showing miRnas whose expression was either upregulated or downregulated (>2- fold) in peripheral blood mononuclear cells of entity list 1 (ASP vs HC), entity list 2 (HAM vs HC), and entity list 3 (ASP vs HAM). Up-regulated miRNA are shown in red and down-regulated miRNA are shown in blue. MiRNA written in green were downregulated in one entity list while upregulated in another entity list.
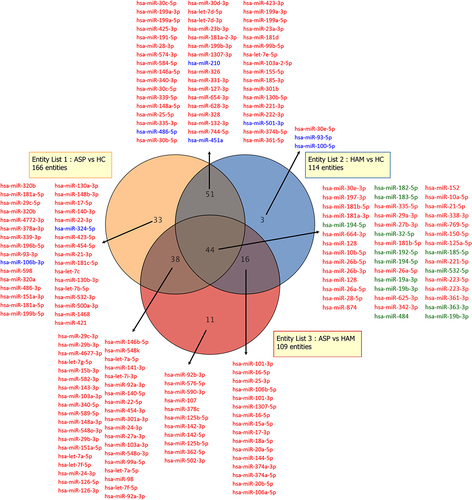
Figure 10. Comparison of miRNA expression levels (hsa-miR-29b-3p and hsa-let-7f-5p) in peripheral blood mononuclear cells from HTLV-1-associated HAM patients compared with HTLV-I-infected asymptomatic carriers with polyclonal T-cell receptor γ gene. The expression levels of selected miRnas were analysed by Qrt-PCR.
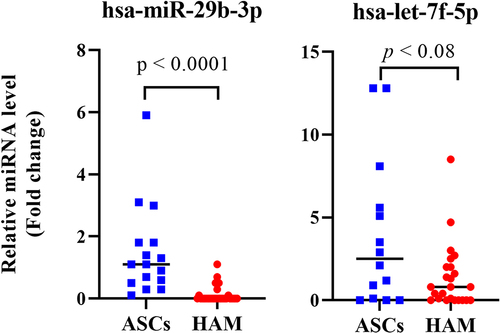
Figure 11. Interaction network between the seven most deregulated mature miRnas and their target genes created with MirWalk v3. Blue circles represent miRnas, orange circles represent mRnas. The more connections there are between miRnas and genes, the more connections there are in the network.
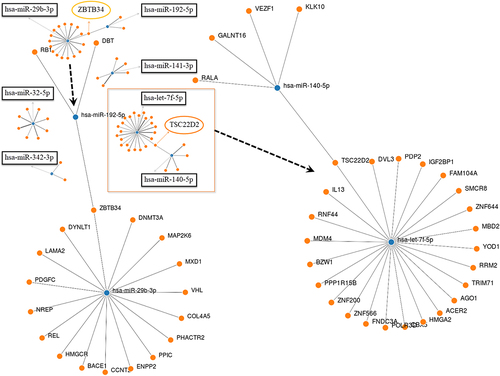
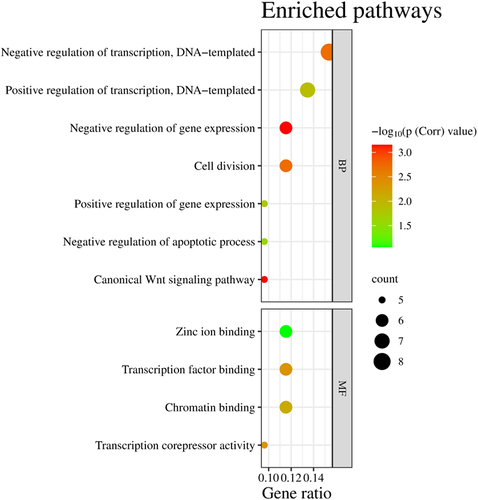
Figure 12. Bubble plot of the significantly enriched GO enriched pathways.
Supplemental Material
Download Zip (4.6 MB)Data availability statement
All raw sRNA data generated by MPS have been deposited in the Zenodo repository https://doi.org/10.5281/zenodo.6528176 and https://doi.org/10.5281/zenodo.1181925.