
Figures & data
Figure 1. AFSV p17 promotes autophagy.
(a) HEK-293T cells were transfected with empty vectors or plasmids expressing Flag-tagged ASFV p17. At 36 h post-transcription, cells were harvested for WB analysis by using anti-GAPDH, anti-LC3, anti-Flag, and anti-SQSTM1 antibodies. (b) Vero and 3D4/21 cells were transfected with vectors expressing ASFV p17 or empty vectors (EV). Cells were harvested at the indicated time points (48 h). IFA and confocal analysis were then performed. GFP-dots and cell numbers were counted by using ImageJ software, n>15. c HEK-293T cells were transfected with plasmids expressing ASFV p17 or empty vectors. At 36 h post-transcription, cells were harvested for TEM (transmission electron microscopy) analysis. The number of autophagosomes per cell was counted by a counter, n>15. Black arrows indicate autophagosomes. At least 3 independent experiments were performed. The error bars show the standard error of the mean (SEM). Significance was analyzed with two-tailed Student’s test. *p<0.05, **p<0.01, ***p<0.001.
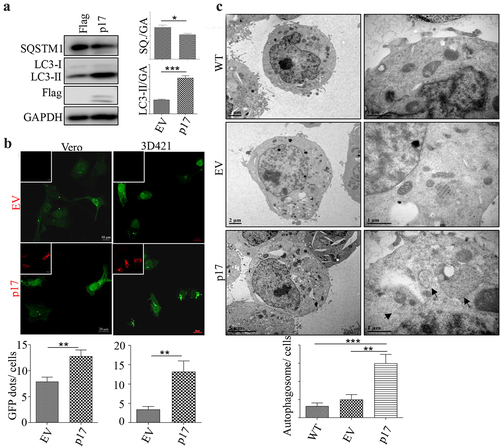
Figure 2. P17 interacts with TOMM70.
3D4/21 (a) or HEK-293T (b) cells were transfected with empty vectors or plasmids expressing Flag-tagged p17. At 36 h post-transcription, cells were harvested for CO-IP. WB analysis was performed by blotting with anti-TOMM70 (T70) and anti-Flag antibodies. (c) HEK-293T cells were transfected with empty vectors or plasmids expressing Flag-tagged p17. At 36 h post-transcription, cells were harvested and used for mitochondrial extraction, and the mitochondrial fraction and cytoplasmic fraction were used for anti-Flag IP. WB analysis was performed by blotting with anti-TOMM70 (T70) and anti-Flag antibodies. (d) HEK-293T cells were cotransfected with Myc-TOMOM70 (Myc-70) and each truncated Flag-GST (F-GST)-tagged P17, such as F-GST-p17 (p17), F-GST-26-66 (26-66), F-GST-1-63 (1-63), and F-GST-67-117 (67-117). GST beads were then used to precipitate each truncated mutant. WB analysis was then performed by blotting with anti-Myc or anti-Flag antibodies. (e) 3D4/21 cells were cotransfected with Flag-p17 or Myc-TOMM70. The fluorescence signals were visualized by confocal immunofluorescence microscopy, scale bars: 5 µm. At least three independent experiments were performed. The error bars show the standard error of the mean (SEM). Significance was analysed with two-tailed Student’s test. *p<0.05, **p<0.01, ***p<0.001.
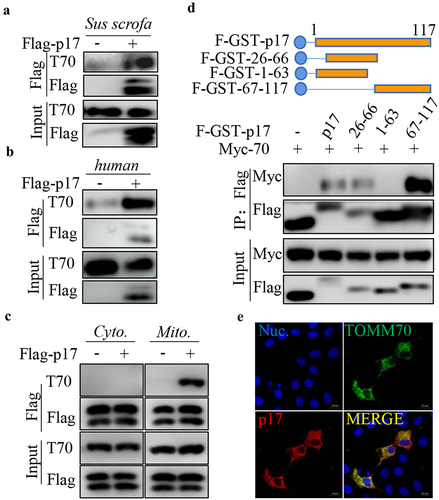
Figure 3. P17 promotes autophagic engulfment of mitochondria by facilitating the binding of SQSTM1 to TOMM70.
(a) HEK-293T cells were cotransfected with Flag-SQSTM1 (Flag-SQ.) and Myc-TOMM70, together with empty vectors or Flag-p17. At 36 h post-transcription, cells were harvested for coimmunoprecipitation (Co-IP). WB assays were performed by using anti-Flag or anti-Myc antibodies. (b) HEK-293T cells were transfected with Flag-SQSTM1 and Myc-TOMM70, together with empty vectors or Flag-p17. At 24 h post-transcription, cells were harvested for confocal analysis. Scale bar: 5 µm. (c) 3D4/21 cells were cotransfected with GFP-LC3B and empty vector (EV) or Flag-p17. At 48 h post-transcription, cells were fixed and subjected to mitochondrial staining with MitoTracker Red CMXRos. Scale Bar: 10 µm. d HEK-293T cells were transfected with empty vectors or Flag-p17. At 36 h post-transcription, sample preparation was performed, and the samples were analysed with a transmission electron microscope. Double membrane vesicles are indicated with black arrows, and mitochondria are indicated with black arrowheads. The number of mitochondria with autophagosomes per cell was counted by counter, n > 15. At least three independent experiments were performed. The error bars show the standard error of the mean (SEM). Significance was analysed with two-tailed Student’s test. *p<0.05, **p<0.01, ***p<0.001.
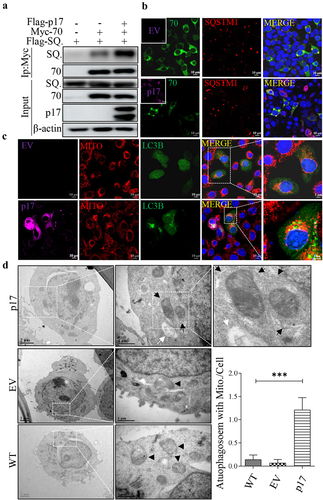
Figure 4. P17 promotes mitochondrial degradation.
(a) HEK-293T cells overexpressing TOMM70 were transfected with different amounts (0.5 μg, 1 μg, 2 μg) of empty vectors or Flag-p17. At 36 h post-transcription, cells were harvested, and cell lysates were then blotted with anti-TOMM70, anti-Flag, and anti-GAPDH antibodies. (b) PAM cells were infected with ASFV (MOI = 1) for indicated time and then harvested for WB analysis using anti-H359L polyclonal antibody, anti-TOMM70 and -β-Actin antibodies. (c) HEK-293T or SQSTM1 (SQ.) KO cells were transfected with Flag-p17 and Myc-TOMM70, either with empty vector or SQSTM1 (SQ.) as indicated for 36 h and were then harvested for WB analysis using anti-TOMM70 and anti-Flag antibodies. (d) 3D4/21 cells were transfected with Flag-p17 or empty vector for 48 hours and were then fixed with 4% paraformaldehyde, followed by mitochondrial staining with MitoTracker Red CMXRos and anti-Flag antibody. The images were captured by confocal microscopy. The mitochondrial branch length was analysed by using ImageJ-MiNA software. Significance was analysed with two-tailed Student’s test. *p < 0.05. Scale bar: 5 µm. (e) HEK-293T cells were transfected with empty vectors or Flag-p17. At 36 h post-transcription, cells were harvested, and cell lysates were then harvested for WB analysis using anti-TOMM70, anti-TOMM20, anti-Flag, and anti-GAPDH antibodies. (f) 3D4/21 cells were transfected with Flag-p17 or empty vector for 48 hours and were then fixed with 4% paraformaldehyde, followed by mitochondrial staining with MitoTracker Red CMXRos and anti-Flag antibody. The number of red dots/cells was counted by ImageJ and quantified. Scale bar: 5 µm. (g) HEK-293T cells were transfected with plasmids expressing ASFV p17 or empty vectors. At 36 h post-transcription, cells were harvested for TEM (transmission electron microscopy) analysis. Black arrows indicate mitochondria. The number of mitochondria/cell was counted by a counter, n > 15. At least three independent experiments were performed. The error bars show the standard error of the mean (SEM). Significance was analysed with two-tailed Student’s test. *p<0.05, **p<0.01, ***p<0.001.
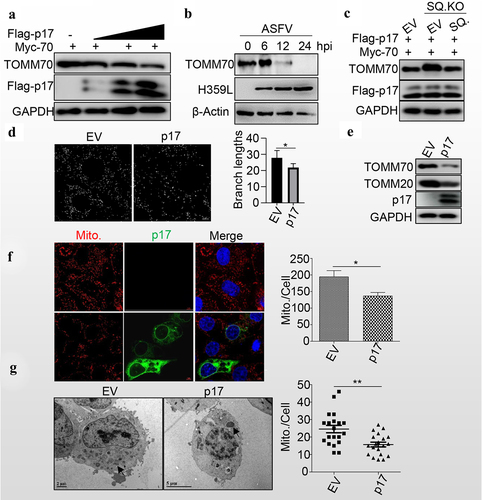
Figure 5. P17 inhibits the innate immune response by autophagic degradation of MAVS.
(a) HEK-293T cells were transfected with empty vector or vectors expressing MAVS, MDA5, and RIGI in the presence or absence of CQ or MG132. The cells were harvested for WB analysis by using anti-MAVS, MDA5, and RIGI antibodies. (b) HEK-293T cells were transfected with empty vector or vectors expressing Flag-p17. The cells were harvested for WB analysis by using anti-MAVS or anti-Flag antibodies. (c, d and e) VERO cells were transfected with empty vector or vector expressing p17 for 24 hours and were then infected with PEDV for 24 hours. The cells were then harvested for qPCR analysis. (f) Vero cells were transfected with empty vector or vector expressing p17 and were then harvested for WB analysis by using anti-PEDV M and GAPDH monoclonal antibodies. (g) Vero cells transfected with EV or vector expressing p17 were infected with PEDV, and the TCID50 was then tested. At least three independent experiments were performed. The error bars show the standard error of the mean (SEM). At least three independent experiments were performed. The error bars show the standard error of the mean (SEM). Significance was analysed with two-tailed Student’s test. *p<0.05, **p<0.01, ***p<0.001.
Data Availability statement
The authors confirm that the data supporting the findings of this study are available within the article.