
Figures & data
Table 1. RT-Qpcr Primer sequence.
Table 2. siRNA target sequence.
Table 3. miRNA quantitative analysis primer sequence.
Table 4. Pri-miRNA quantitative analysis primer sequence.
Table 5. The mimic sequence of miR-30a-5p is shown in the table.
Figure 1. PCV2 infection affects the expression level of m6A methylation in PK-15 cells.
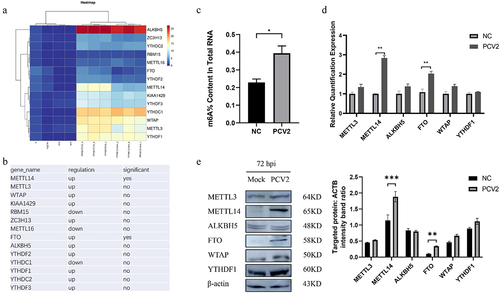
Figure 2. METTL14 and FTO regulate the level of m6A methylation in PK-15 cells. (a, b) METTL14 and FTO knockdown efficiency in each of three siRNA-transfected PK-15 cells at 48 h and 72 h post-transfection. β-actin served as a loading control in the western blot. Western blotting of METTL14 and FTO. (c).
Figure 3. METTL14 and FTO regulate PCV2 replication in PK-15 cells. (a) RT-qPCR detection of PCV2 mRNA expression at 48 h and 72 h in the overexpression group (b) RT-qPCR detection of PCV2 virus in the siRNA group, (c) Cap protein expression of PCV2 virus at 48 h and 72 h in oe-pc3.1-METTLE14, oe-pc3.1-FTO, si-METTLE14, si-FTO and PK-15 cells of the control group, (d) RT-qPCR detection of miRNA expression at 72 h in the PCV2 virus-infected and uninfected groups.
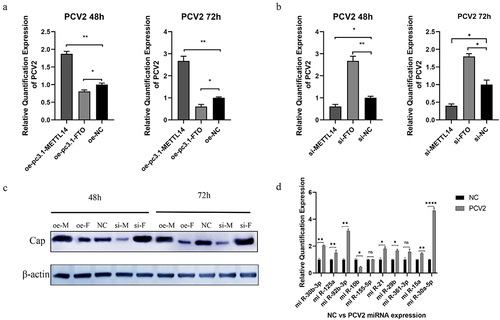
Figure 4. miRnas were quantified by RT-qPCR upon METTL14 and FTO depletion or overexpression in PK-15 cells after PCV2 infection.
Figure 5. Pri-miRnas were quantified by RT-qPCR upon METTL14 and FTO depletion or overexpression in PK-15 cells after PCV2 infection.
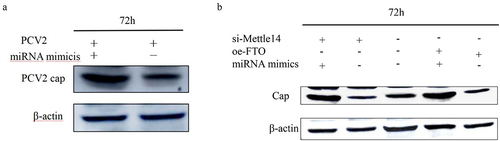
Figure 6. MiR-30a-5p promotes PCV2 replication. (a) western blot detection of cap protein expression in PK-15 cells infected with PCV2 under the action of miR-30a-5p mimics. (b) Western blot detection of cap protein expression in PK-15 cells infected with PCV2 under the action of miR-30a-5p mimics, oe-FTO, and si-METTL14.
Data Availability statement
The data that support the findings of this study are available from the corresponding author, [[email protected]], upon reasonable request.